How we evaluate our search
Disclaimer: our journey to the current retrieval system is part of a larger topic area and it will have it's long form post. This part will be talking about how we evaluate our search engine in an ecologically valid manner and also posting the results.
Current Status: write-up phase
Update logs
- 25th April 2025 - completed single doc evaluation for 200 queries.
Overview
The purpose of search is to be able to find the relevant information given a query. The 'experience of search' is what is called the performance which can include items such as
- rankings of the most relevant search
- number of turns till relevant results (average # turns it takes to reach results)
- latency (average seconds to run search)
- costs per search (average $ per search)
Intuitively, it's almost like going onto google and searching for an something - how long does it take to get a result, how many searches does it take on average to get to your result, how much does it cost (ads), and where is your relevant result ranked?
Ranking is more specific to an interface for a user whereas for agents, it is less important unless context exceeds X00k in the input window (which is where you may see degradations in answer performances due to needle in haystack issues).
As such in terms of units of performance per search, what we're judging is the following:
| metric | calculation | unit |
|---|---|---|
| latency | total time taken to produce final search_results | seconds (s) |
| recall | number of relevant_results / total number of relevant_results | percent (%) |
| spend | sum of the $ token cost of using LMs | dollar ($) |
| precision | number of relevant_results / number of search_results | percent (%) |
| sufficiency | assertion on if {search_results} has sufficient {context} to answer {query} | boolean (true/false) |
And the metric we get out, is the averages of the above. Sufficiency is important as recall is a good proxy to get on a per search basis how many results should we expect to be relevant whereas sufficiency is what is actually required (i.e. did we get all the context needed to answer the question).
Sufficiency is also important where we cannot assert true recall. True recall can be difficult as there can be multiple sets of information that is sufficient to answer a question as such sufficiency helps compliment the recall metric if the ground truth page targets aren't exclusive to one set.
Actually defining what it means to 'test search' functionally
Search itself is too broad of a term as functionally it is always constrained i.e. you wouldn't search for someone's LinkedIn on Youtube and utilise that as the measurement for performance.
As such we need to map out a few core functionalities that people would utilise the search on (to ensure ecological validity), boil those functionalities into units that can be parallelised (for latency) and finally measure the performance of the search (recall).
[to be defined better here... and '...' means that we will continually extending the set]
| given | purpose | multi |
|---|---|---|
| document | the user can search over one document | search over multiple documents |
| equity_ticker + fiscal_year + fiscal_quarter | the user can search over a fiscal event | search over multiple fiscal events |
| equity_ticker + fiscal_year | the user can search over fiscal years | search over fiscal years |
| ... | ... | ... |
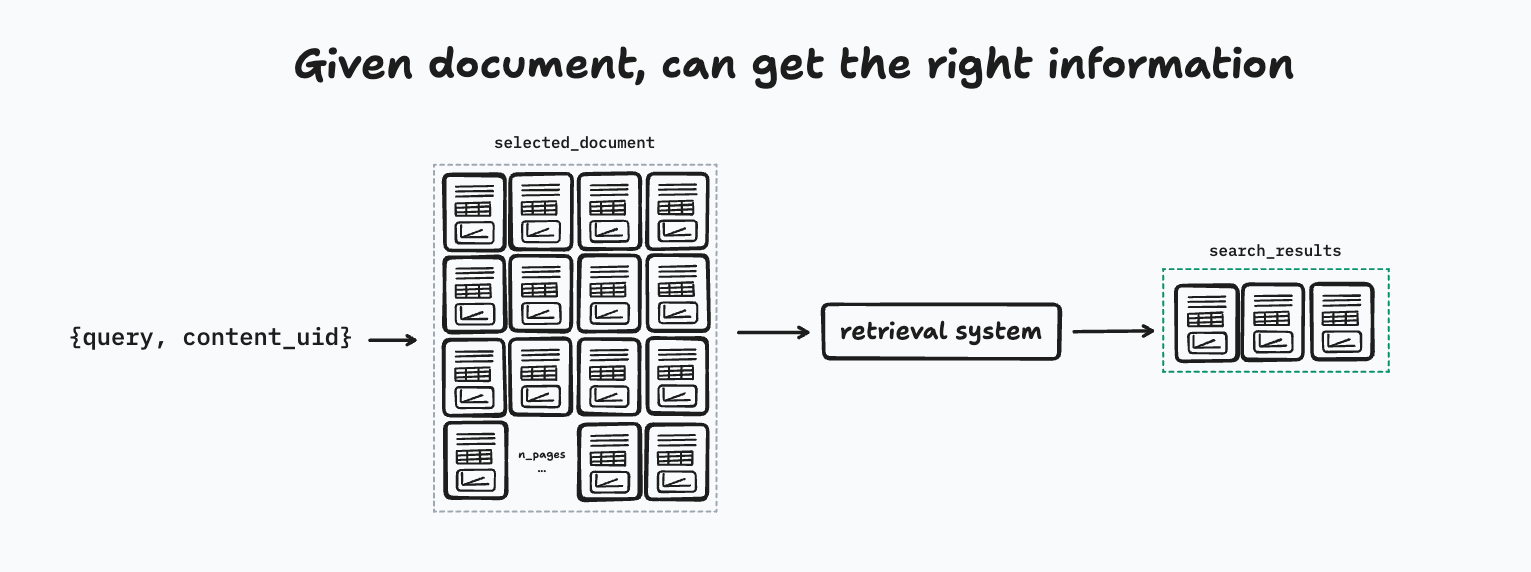
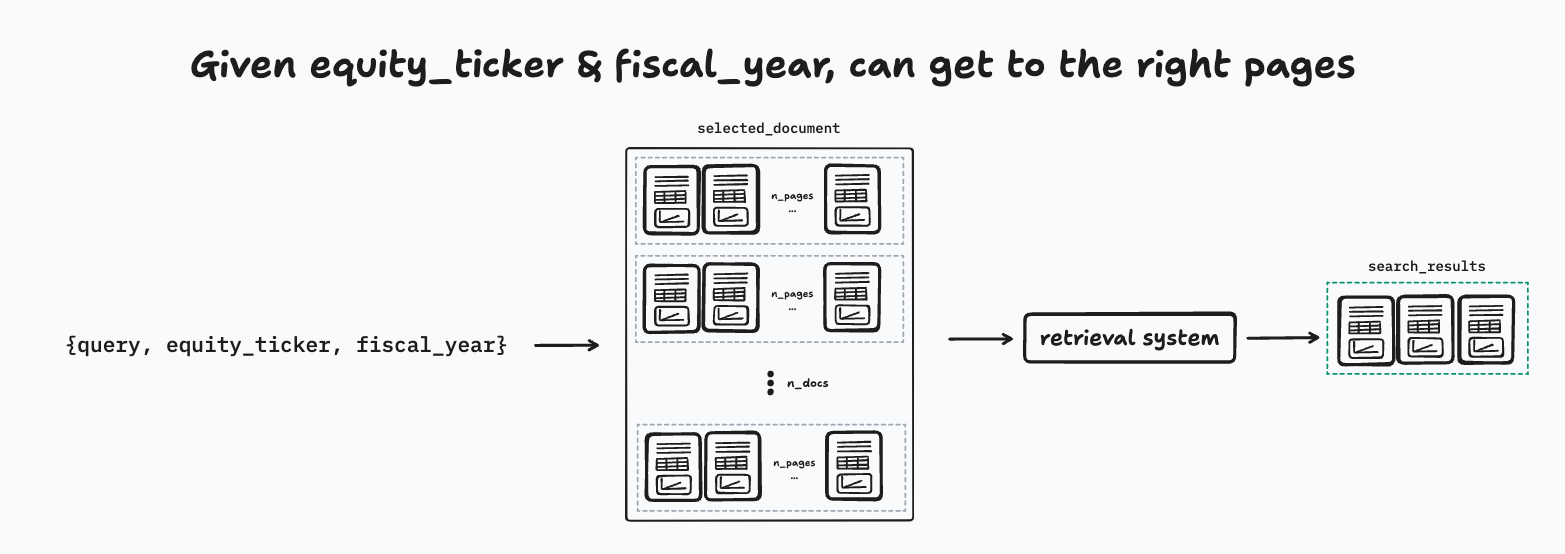
After we've functionally defined essentially the metadata filter sets our system expects, we can synthetically generate evaluations.
We leverage long context LLMs to generate an array of query, relevant pages, and answer tests. As these LLMs gets better in long context tasks (specifically in recall over a larger context window), the accuracy of the generated sets increases and also as these models get more intelligent, the ability to tune it to generate more complex / domain-specific evals becomes more plausible.
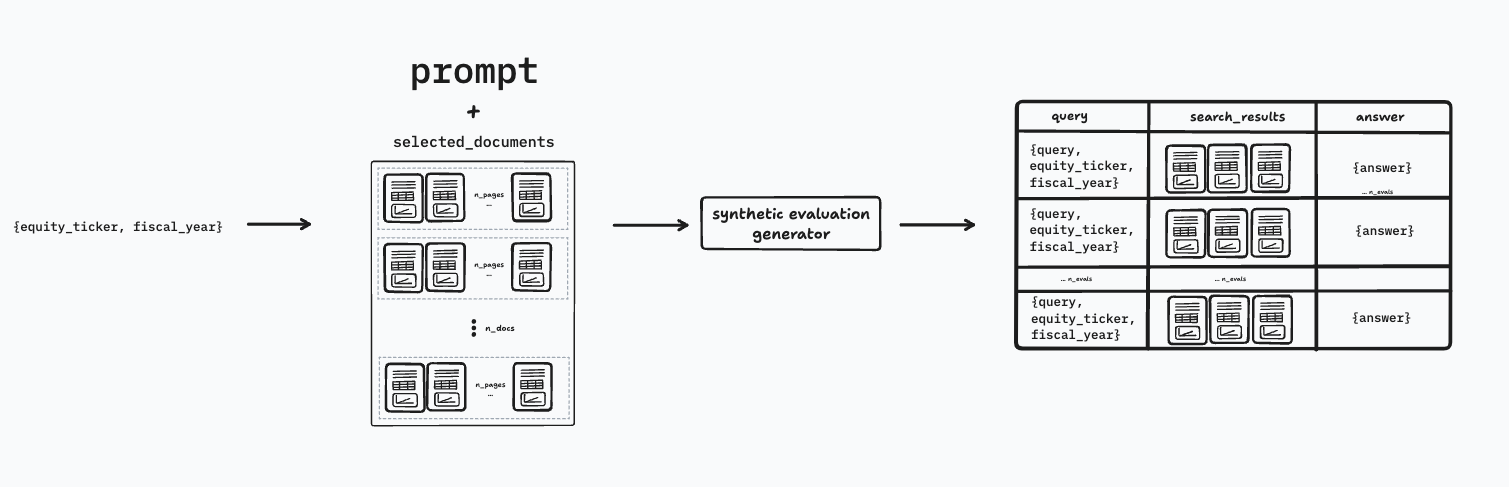
We utilise the same premise for the other search functionalities we test and that helps us ensure we cover a much larger expected search space. This way of ordering evaluation generations is also more efficient as it is easier to validate/prune question/answer pairs than it is for a human to generate them.
Note: we have already experimented with utilising long context LLMs and have seen good initial performances (answer quality), however the issue comes down to latency where we can hit the same performance as long context llm hits (and better) at 15-18x reduction in latency (50s -> 3s)
Experimental Overview
We'll be evaluating the search capabilities from the below first
- document search: given(document)
- ficsal_event search: given(equity_ticker, fiscal_year, fiscal_quarter, event_type=periodic)
- fiscal_year search: given(equity_ticker, fiscal_year)
Each one will follow the same structure of process
- generate synthetic evaluations
- run evaluations and on a per search basis generate performance metrics
- recall@top_k
- latency@top_k
- sufficiency@top_k
- precision@top_k
- create summary statistics & commentary over the statistics
Note: top_k is a key configuration. top_k will naturally improve recall & (most likely) sufficiency however the trade-off is likely on downstream capabilities i.e. more top_k means LLMs using the context to generate may face higher token costs (spend), suffer higher latency, and face accuracy degradations (not included in search evals). There is likely the 'highest top_k' that we can have without seeing downgrade performance degradations however this can only be judged in symbiosis with the answer engine.
The above will likely evolve as the search tests are being run and all will be logged below.
Experiment 1 - Document Search Evaluations
Data Structure
| column | data_type | level |
|---|---|---|
query |
str | input |
content_uid |
str | input |
gt_page_targets |
list[int] | ground_truth_output |
gt_answer |
str | ground_truth_output |
equity_ticker |
str | doc_metadta |
fiscal_year |
int | doc_metadata |
fiscal_quarter |
int | doc_metadata |
content_type |
str | doc_metadata |
published_date |
date | doc_metadata |
fiscal_date |
date | doc_metadata |
event_type |
str | doc_metadata |
v_{search_config}_page_targets |
str | variant_output |
v_{search_config}_answer |
str | variant_output |
| ... (other variants) | str | variant_output |
Note: we will need to add query level features to be able to explore the hit rates, but we can do that after we generate some queries.
querygt_page_targetsgt_answerare all generated via synthetic evaluationsv_{search_config}_page_targetsv_{search_config}answer is a variant search config and it's associated output where we can have n number of search_config.
Search Configs
| search_config | description/utility |
|---|---|
top_k |
increasing this will increase search results |
reranking_model |
this allows for a higher initial top_k and also allow for hybrid search |
reranker_top_k |
top_k for reranker |
is_vector_index_on |
bool, this can improve latency but degrade performance. in Lance it's IVQ-PQ |
embeddings_model |
this is fixed for now and we're using voyage-multimodal-3 |
embeddings_text_variant |
this is the text_variant that is embedded along with the image. we use text_gemini_2_0_flash for now |
query_decomposor |
query can get decomposed ahead of being searched |
vectordb |
this is fixed for now and we're using LanceDB |
include_fts |
bool, to include full text_search results |
To visualise this better, there are two steps where the search configs come into play
Preprocessing configs: text_variant=text_gemini_2_0_flash, embeddings_model=voyage-multimodal-3, vectordb=LanceDB
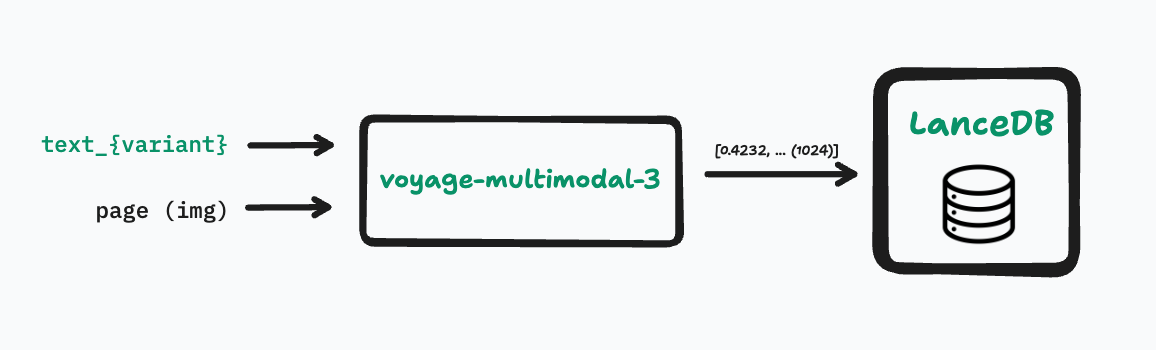
Note: in the preprocessing step, these sets of configs cannot be changed at runtime as such is greyed out
Runtime configs: top_k, is_vector_index_on, query_decomposer, include_fts, reranker_top_k, reranking_model

You can see that depending on certain configs, it requires configs later e.g. including full-text-search ("FTS") requires a reranker as we're searching over two types of modalities - text and text+images.
As there are many variants, we start off with the simplest variant, and for naming convention simplicity purposes, we can call this search_config variant - simple
Initial Search Config
v_simple
| search_config | values |
|---|---|
top_k |
[3, 5, 10] |
reranking_model |
None |
reranker_top_k |
None |
is_vector_index_on |
False |
embeddings_model |
voyage-multimodal-3 |
embeddings_text_variant |
text_gemini_2_0_flash |
query_decomposor |
None |
vectordb |
LanceDB |
include_fts |
False |
Dataset to generate synthetic evaluations from
We choose 10 documents each representing a different content_type from the closet time to today's period.
Synthetic Evaluations Set-up
From our synthetic prompt, we have two sets of query features which we can intuitively interpret as the 'types of questions' that an analyst may ask. See in Appendix for the system's prompt. Below are the generation_configs.
| generation_config | values |
|---|---|
query_type |
[ "revenue", "margins", "balance_sheet", "cash_flow", "outlook", "other" ] |
query_sub_type |
[ "revenue_growth_driver_kpi", "price_volume_decomposition", "mix_acceleration", "comp_waterfall", "box_replicator", "revenue_growth_durability", "segment_revenue", "geographic_revenue", "backlog_deferred_revenue", "specific_event_margin_impact", "fixed_variable_semi_fixed_cost_analysis", "incremental_margin_analysis", "unit_economics_cost_profit_focus", "gross_margin_analysis", "operating_expense_analysis", "non_gaap_reconciliation_analysis", "balance_sheet_liquidity_analysis", "financial_health_risk_assessment", "capital_intensity_analysis", "working_capital_analysis", "debt_analysis_structure_covenants", "intangibles_goodwill_analysis", "free_cash_flow_stack_definition_calculation", "capital_deployment_options_evaluation", "cash_burn_runway_analysis", "cash_conversion_cycle", "quality_of_earnings_analysis", "capex_analysis", "forward_looking_guidance_assumptions", "kpi_analysis", "risk_analysis", "strategy_analysis", "competition_analysis", "related_party_transactions", "qualitative_tone_messaging_analysis" ] |
model |
gemini-2.5-pro-preview-03-25 |
prompt_version |
v1 |
num_evals |
20 |
temperature |
0.2 |
As we'll be generating 20 evals per document, we will have around 200 Q&A pairs to initially utilise and evaluate over.
Note: there is probably a better distribution on the number of evals for a given content_type, however we take num_evals=20 as a simple assumption for now as we can always generate more if needed.
Generating Synthetic Evaluations
Adding requirements for the search configs
Schema Enforcement
Generation
Extra query feature: Generated 20 eval sets. Another query feature is the min_top_k, this would be interesting as some queries will require more top_ks than others (and may probe to some need for a 'dynamic' top_k assertion although may be subsumed by the 'agentic qa' system)
Note: answers are generated already as it serves to get the LLM to reason about answers that analysts would want and also extends the utility of this testset as we will be able to use this for verified rows as ground truth answers.
Running Evaluations Set-up

For simplicity, we'll omit sufficiency as that'll be introducing another llm-as-a-judge
table construction notes
- input
- query
- content_uid
- doc_metadata
- content_name
- equity_ticker
- page_count
- content_type
- cannonical_pdf_url
query features
- query_type
- query_sub_type
- min_top_k
- ground_truth
- gt_page_targets
- search_result
- v_simple_page_targets
- performance
- latency
- recall
Single Document Evaluation Results
See here in the sheets for full results
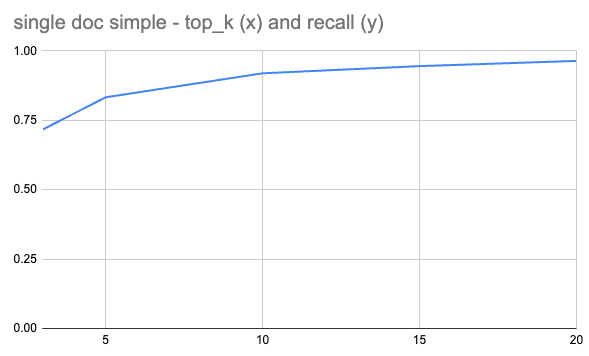
Note: the latency doesn't include a content_uid_index (BITMAP) and should improve latency.
| search_config_variant | top_k | average recall | average latency | content_uid_index |
|---|---|---|---|---|
| simple | 3 | 0.717061498 | 5.044760728 | FALSE |
| simple | 5 | 0.8328547499 | 4.9523114 | FALSE |
| simple | 10 | 0.9193228045 | 5.729189948 | FALSE |
| simple | 15 | 0.9452141661 | 5.445839321 | FALSE |
| simple | 20 | 0.9639626705 | 5.671823323 | FALSE |
Thoughts
- min_top_k
- some of these query/page_target pairs from generated have > top_k assigned in the runs, as such will naturally have lower recall.
- add more metrics
- NCDG - rank/order aware (helps with asserting quality of embeddings based on rank awareness). This is more important for when we're returning search to users rather than agents.
- Sufficiency - helpful for asserting if there were sets that actually answered the query (omits false negatives which can be the case when 'true recall' is hard to assert)
Next steps:
- explore distributions: there seems to be a strong distribution of 1s and lows. Curious how much top_k affected the low performers and what types of queries were they (i.e. are they going to be more common than is represented in the testset?); then also the correlation for the pages to recall levels.
- same process, different search function: next one will be a search over a fiscal_event, will run through the same process
Experiment 2 - Fiscal Event Search Evaluations
We define fiscal events as the quarterly (if US) and periodic events where companies produce information. Typically this includes a regulatory filing (10-K/10-Q) and non-regulatory information e.g. earnings press releases, earnings presentation, earnings transcript.
A lot of the structure of this experiment will be similar in structure of data to the Experiment 1 except the search input is different (hence evaluation generation too).
Data set-up
In our experiment a fiscal_event contains annual_report OR quarterly_report & earnings_presentation, earnings_press_release, earnings_presentation so per fiscal_event it will be a search over four documents.
| content_name | content_type | periodicity | geography | file_type | published_date | fiscal_date | fiscal_year | fiscal_quarter |
|---|---|---|---|---|---|---|---|---|
| KO Q1 2024 quarterly_report | quarterly_report | periodic | US | 2024-05-02 | 2024-03-29 | 2024 | 1 | |
| KO Q1 2024 Press Release | earnings_press_release | periodic | US | 2024-04-30 | 2024-04-30 | 2024 | 1 | |
| KO Q1 2024 Transcript | earnings_transcript | periodic | US | 2024-04-30 | 2024-04-30 | 2024 | 1 | |
| KO Q1 2024 Presentation | earnings_presentation | periodic | US | 2024-04-30 | 2024-04-30 | 2024 | 1 | |
| KO Q2 2024 quarterly_report | quarterly_report | periodic | US | 2024-07-29 | 2024-06-28 | 2024 | 2 | |
| KO Q2 2024 Presentation | earnings_presentation | periodic | US | 2024-07-23 | 2024-07-23 | 2024 | 2 | |
| KO Q2 2024 Press Release | earnings_press_release | periodic | US | 2024-07-23 | 2024-07-23 | 2024 | 2 | |
| KO Q2 2024 Transcript | earnings_transcript | periodic | US | 2024-07-23 | 2024-07-23 | 2024 | 2 | |
| KO Q3 2024 Presentation | earnings_presentation | periodic | US | 2024-10-23 | 2024-10-23 | 2024 | 3 | |
| KO Q3 2024 quarterly_report | quarterly_report | periodic | US | 2024-10-24 | 2024-09-27 | 2024 | 3 | |
| KO Q3 2024 Press Release | earnings_press_release | periodic | US | 2024-10-23 | 2024-10-23 | 2024 | 3 | |
| KO Q3 2024 Transcript | earnings_transcript | periodic | US | 2024-10-23 | 2024-10-23 | 2024 | 3 | |
| KO Q4 2024 annual_report | annual_report | periodic | US | 2025-02-20 | 2024-12-31 | 2024 | 4 | |
| KO Q4 2024 Presentation | earnings_presentation | periodic | US | 2025-02-11 | 2025-02-11 | 2024 | 4 | |
| KO Q4 2024 Press Release | earnings_press_release | periodic | US | 2025-02-11 | 2025-02-11 | 2024 | 4 | |
| KO Q4 2024 Transcript | earnings_transcript | periodic | US | 2025-02-11 | 2025-02-11 | 2024 | 4 |
Generating Synthetic Evaluations
Since the intention of this kind of search is intended to be a broader search that is may require multiple pages from multiple documents, we would need to weak the prompt slightly to ensure the LM understands this.
The JSON structure we previously defined would also need to change as it only handled for the case where we had one document.
content_uid helps us identify the unique document and then the page_numbers associated to that content_uid helps us identify the page_targets. If we follow the same convention of footnotes in answer, and sources, we would only need to ensure that each footnote is supported by a given page. To avoid needle in the haystack problems, we will use content_name instead of the content_uid.
We'll assume that one footnote is associated to one page from a given content_name, as such the sources array that the LM produces will be an array of the below JSON object:
{
  "footnote_index": int,
  "page_target": int,
  "content_name": int,
}
Sourcing JSON
To ensure that that the LM knows what content_names to be filling in, given we know apriori the content_names it should use, we can enforce this in the schema for each fiscal_event.
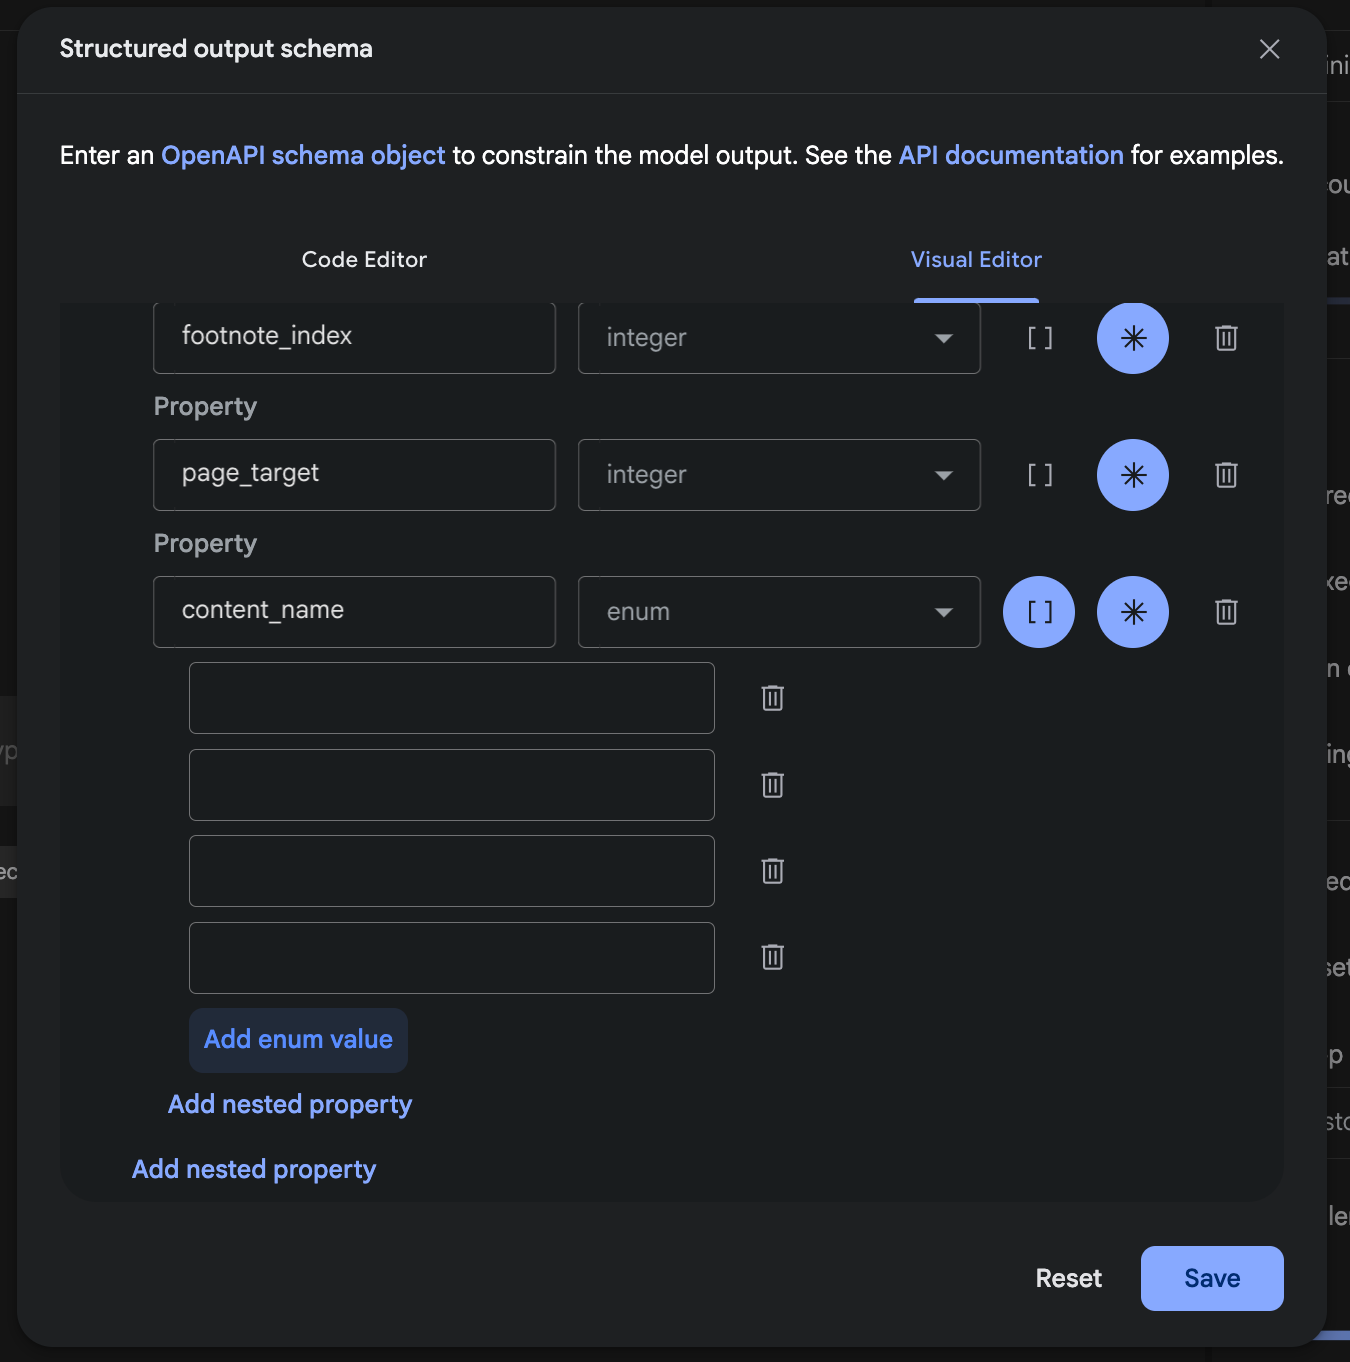
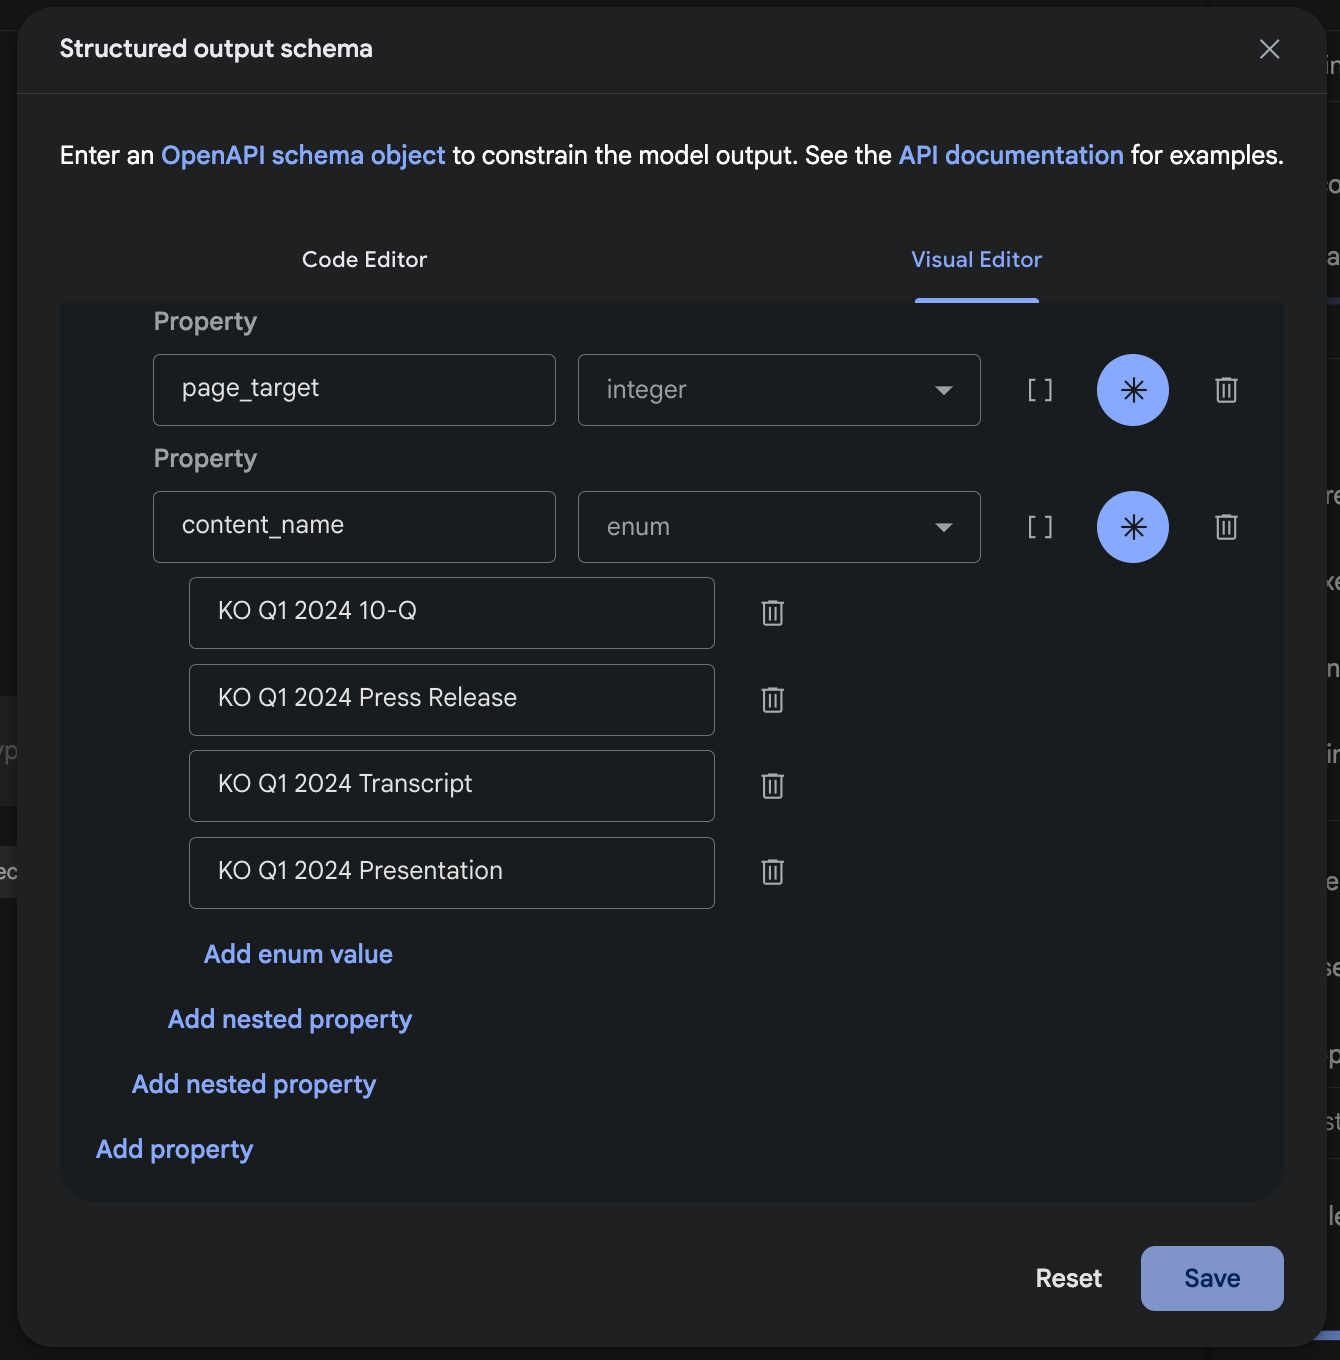
We'll be generating 50 per fiscal_event and as we're covering fiscal_year=2024 it means in total, we'll have 200 tests.
See in the Appendix the new prompt.
Sub-experiment - simple: Results from Single Fiscal Event Search - Simple Variant
Note: the experimentation principle is to start with the minimally functional components to run a search, this is so that we can stress-test the embeddings models capabilities. There are a lot more low hanging configurations that are yet to be added on.
Initial Results - Simple Variant
| variant | top_k | avg recall | avg latency |
|---|---|---|---|
| simple | 5 | 0.3785157988 | 5.98549081 |
| simple | 10 | 0.4895082332 | 6.064102093 |
| simple | 15 | 0.5647863818 | 6.162922318 |
| simple | 20 | 0.6148308856 | 6.661631889 |
| simple | 25 | 0.6535825545 | 6.824575813 |
| simple | 30 | 0.6863818425 | 7.148297354 |
| simple | 40 | 0.7480752114 | 7.297151119 |
| simple | 50 | 0.7802514464 | 7.789936925 |
| simple | 60 | 0.8099799733 | 7.771690384 |
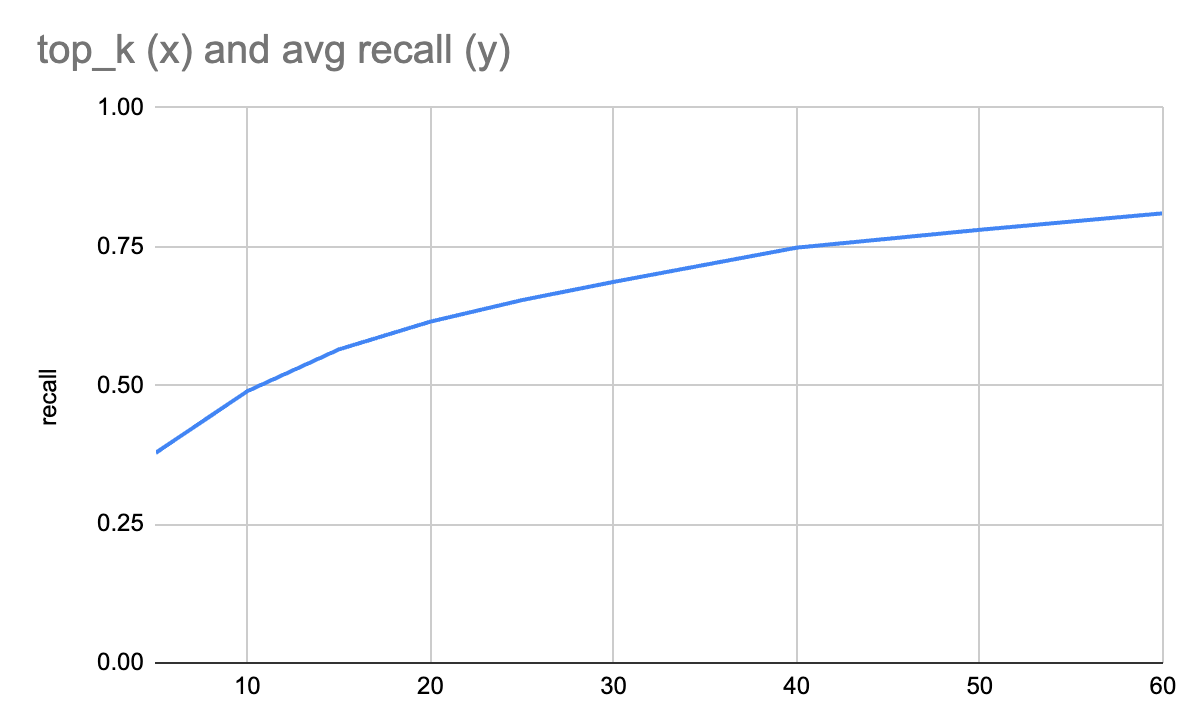
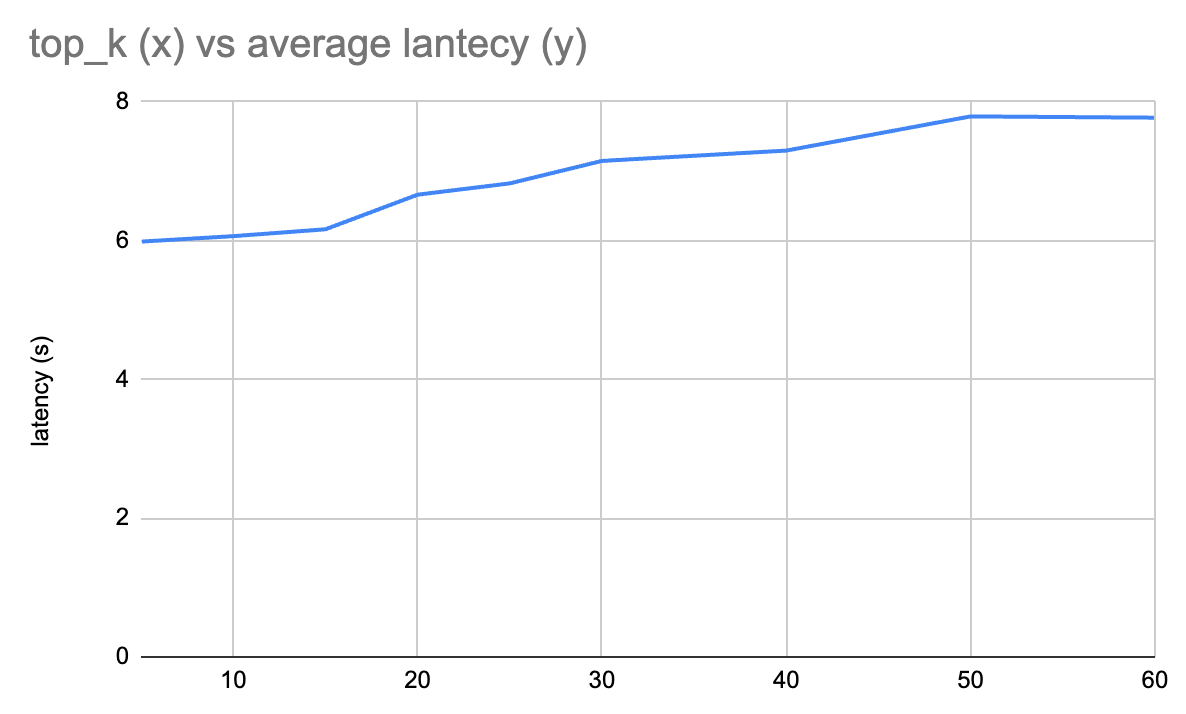
Comments
- the problem: problems come from not being able to find the right (in order): (1) press releases; (2) transcripts; (3) 10-Qs.
- distributions that'd be good to know
- when we run search on 5 -> 10 -> ... -> 60, on average what content_type does it index mostly on? is there some implicit bias to prefer some content_types over others?
- if yes: then we should definitely run search on a per content_type basis to be able to leverage the initial cosine distance however this means we'll get returned n_conetnt_types more results as such would need a reranker.
- when we run search on 5 -> 10 -> ... -> 60, on average what content_type does it index mostly on? is there some implicit bias to prefer some content_types over others?
- run a test on each content_type i.e. how does top_k on each content_type (4) different with the total top_k e.g.
- top_k = 5 for each content_type = 20 vs top_k=20 on simple version
- if there is no delta, then that would be very odd i.e. potentially a bug given our single document retrieval yields a pretty good performance.
check: is there a bug? it seems odd for it to consistently fail in press releases. A good test would be to have a search per content type and if it still fails, then perhaps there's an error. also check if parsed_text wasn't passed down to the embeddings.
Diagnosing the low recall rates
Test: does searching directly on the document with the same query (i.e. the query itself is intended for multi-doc) hit the page targets?
Result: mostly yes. If we do a top_k search per content_type, it'll return more hits than a non per content_type search.
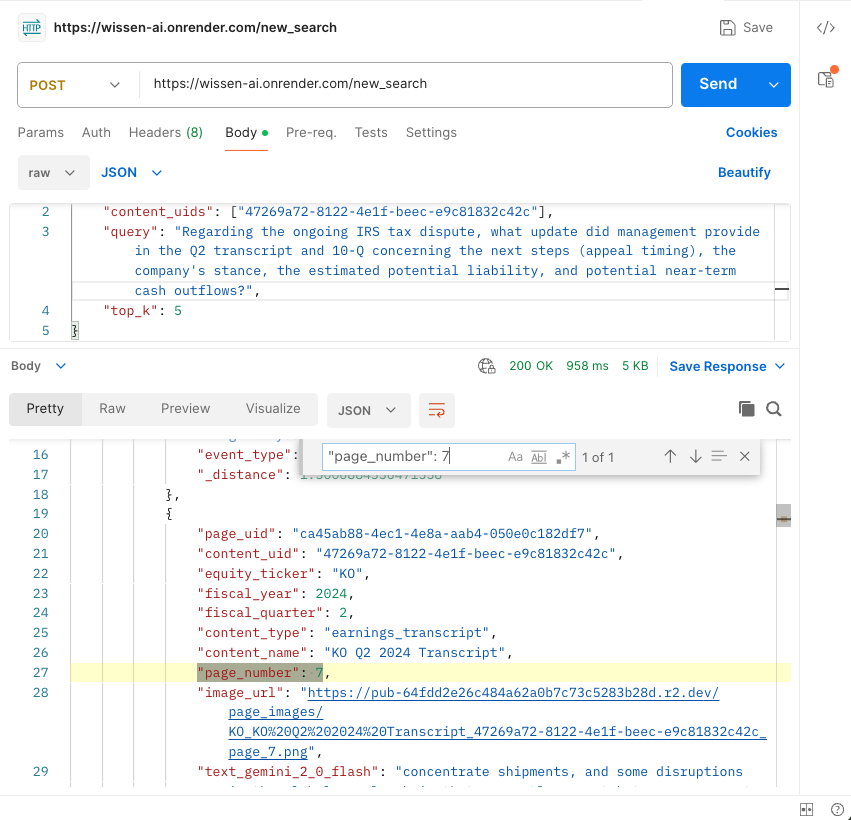
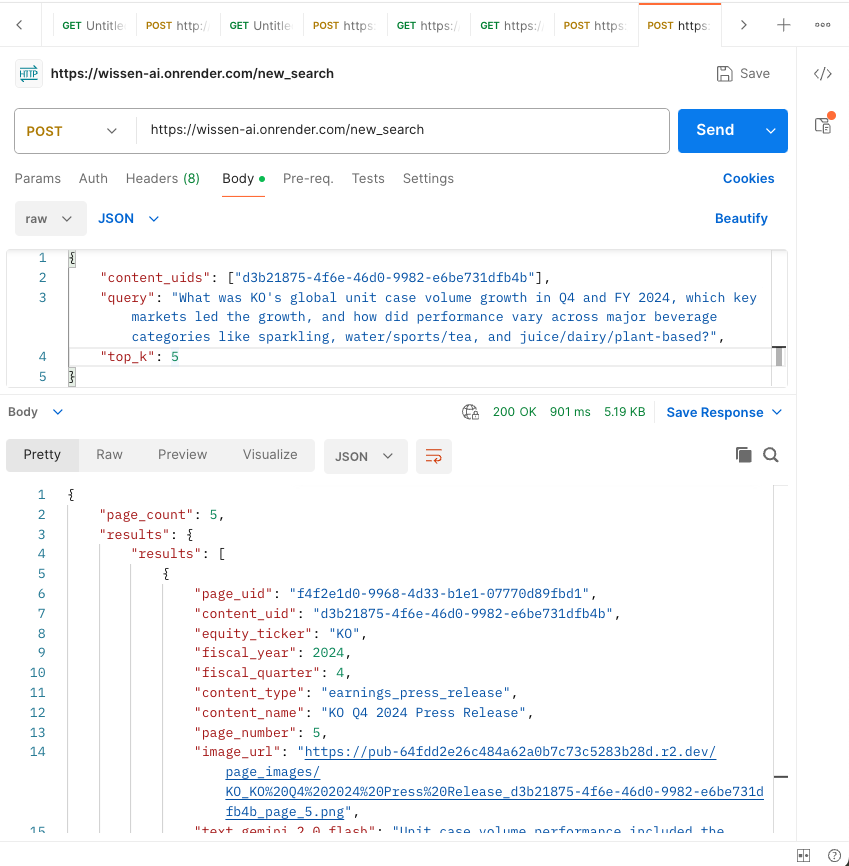
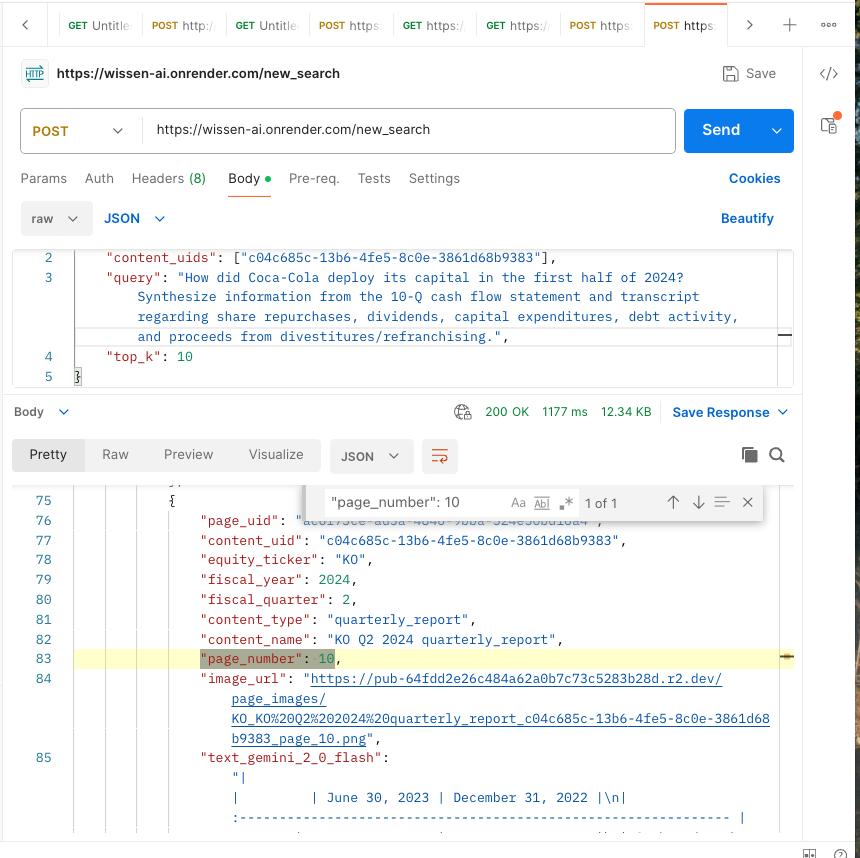
Action: will then change the search so that it's not per content_type. We'll call this variant simple-per-content
Sub-experiment - simple-per-content: Results from Single Fiscal Event Search - Simple + Per Content Type
The core comparison we want is - simple total top_k vs per content_type total top_k: which one has a higher recall.
Since we have 4 content_types - earnings_transcript, annual_report | quaterly_report, earnings_press_release, and earnings_presentation, we can compare based on multiples of 4 e.g. total_top_k = 20 which means top_k is set to 5.
| variant | top_k | avg recall | avg latency |
|---|---|---|---|
| simple | 20 | 0.6148308856 | 6.661631889 |
| simple | 40 | 0.7480752114 | 7.297151119 |
| simple | 60 | 0.8099799733 | 7.771690384 |
| simple-per-content | 20 | 0.6994993324 | 8.378678131 |
| simple-per-content | 40 | 0.8438696039 | 9.055654558 |
| simple-per-content | 60 | 0.9055740988 | 8.465420016 |
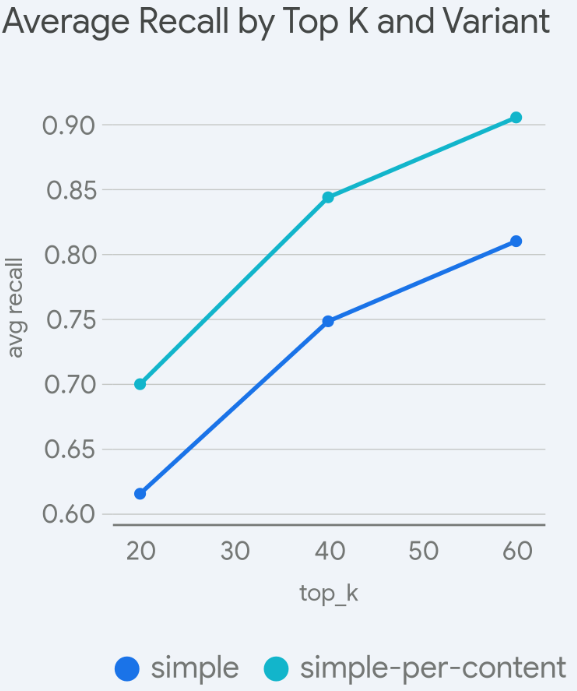
Comments:
- same top_k sensitivty: top_k sensitivity seems to be the same i.e. they're both equally 'as sensitive' to the top_k changes except the
simple-per-contentvariant is able to reach a much higher recall result (before tailing off) thansimple - recall boundaries: you can see that with the simple approach, the amount you get per top_k reduces pretty quickly due to a worse starting point
- general: probably want top_k sensitivity to recall to be as high as possible, although the base unit is {n} content_types.
- caveat: in this instance it's also essentially doing single doc queries, as such will need to test if 'more' content_types degrades performances.
- needs: as we start hitting >top_k = 50, we start having context loads of 100k tokens (~2k tkns per k), we need to consider a reranker. precision naturally takes a hit. however, before we consider precision, we need to ensure we have recall (i.e. you can't be precise without recall).
- This is especially true, if we need to make the base unit of search on a content_type basis (i.e. our total_top_k becomes much more sensitive to initial top_k configuration).
- still: there may still be certain queries that cannot be caught as such necessitates some 'query decomposition' to translate the query. given we have qa pairs, we can utilise them to help map the 'right' queries.
think: we should probably prefix a limit on the total_top_k we're willing to return as such gives more flexibility
Sub-experiment - simple-per-content-rerank: results from adding a reranker
What we want to test here is if we introduce a reranker say at where total_top_k = 20 | 40 | 60, does recall take a hit? If it doesn't it means the reranker is effective to preserve recall yet improve precision.
In this implementation, we'll test simple-per-content + a reranker.
| Company / Org | Model name (latest public version) | Type |
|---|---|---|
| Cohere | Rerank 3 | Text reranker |
| Voyage AI | rerank-2 and rerank-2-lite | Text reranker (multilingual, long context) |
| BAAI (FlagEmbedding) | bge-reranker-v2-m3 | Text reranker (multilingual, open-source) |
| Contextual AI | Instruction-Following Reranker | Text reranker (instruction-following) |
| Jina AI | jina-reranker-m0 | Multimodal reranker (vision-language, multilingual) |
| LightOn | MonoQwen2-VL-v0.1 | Multimodal visual-document reranker |
There's a few rerankers available, we'll start off with voyage rerank-2 given we're used to their implementation. Specifically we are reranking text (not images).
Note: ColQwen/ColPali are also another type of reranker that we can set-up and I suspect this will yield the highest performance for us due to the multivector representations. As it will take some more engineering work, we can do this after should reranking performance be poor.
Quick vibes test with rerank-2 - seems to work well to get the reranked results from 60 -> 10.
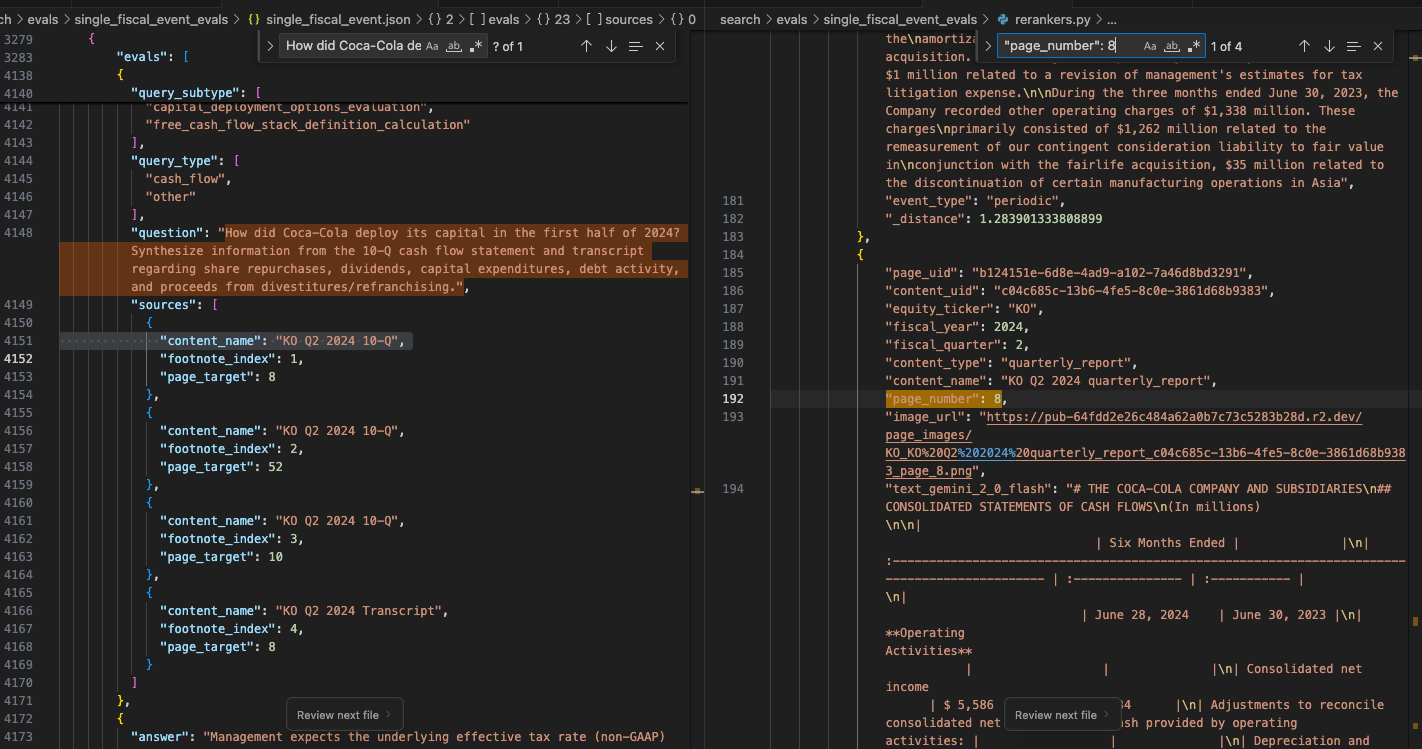
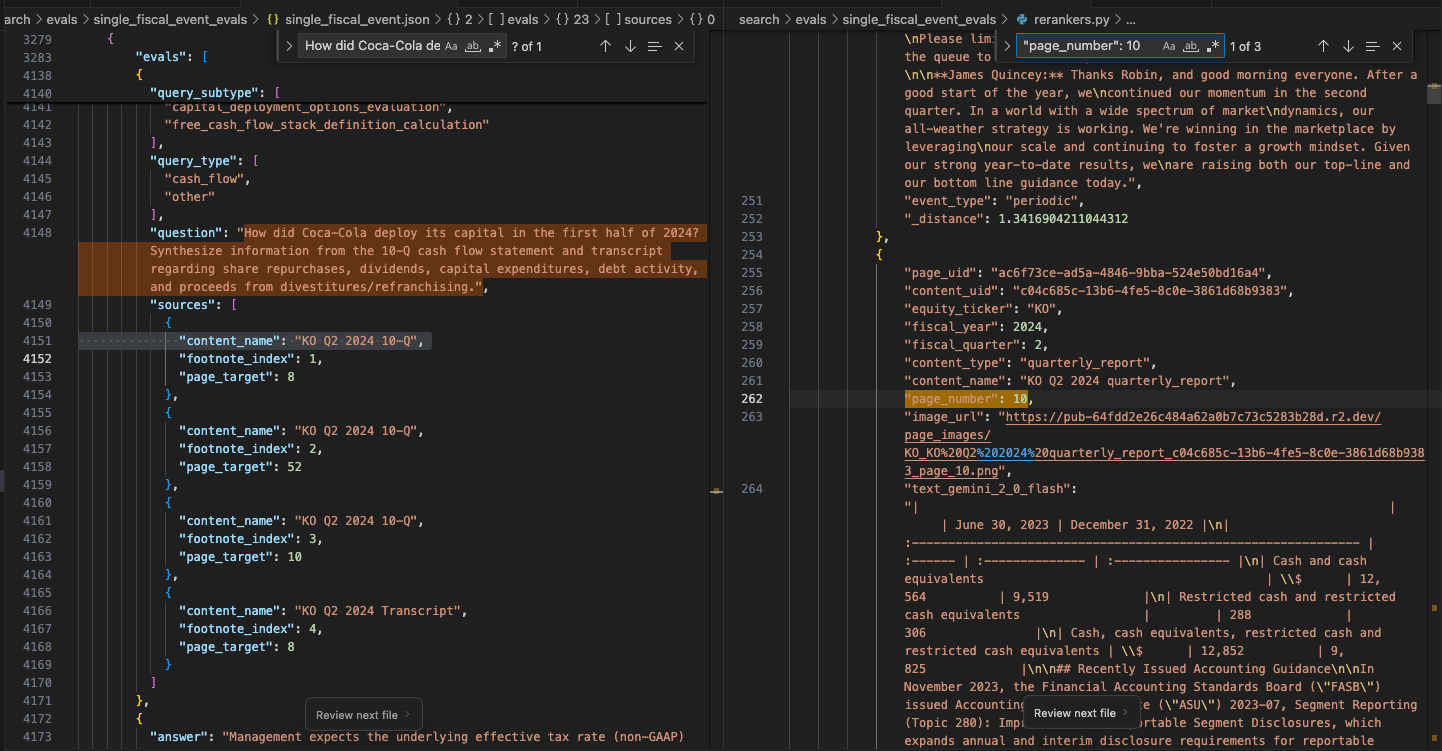
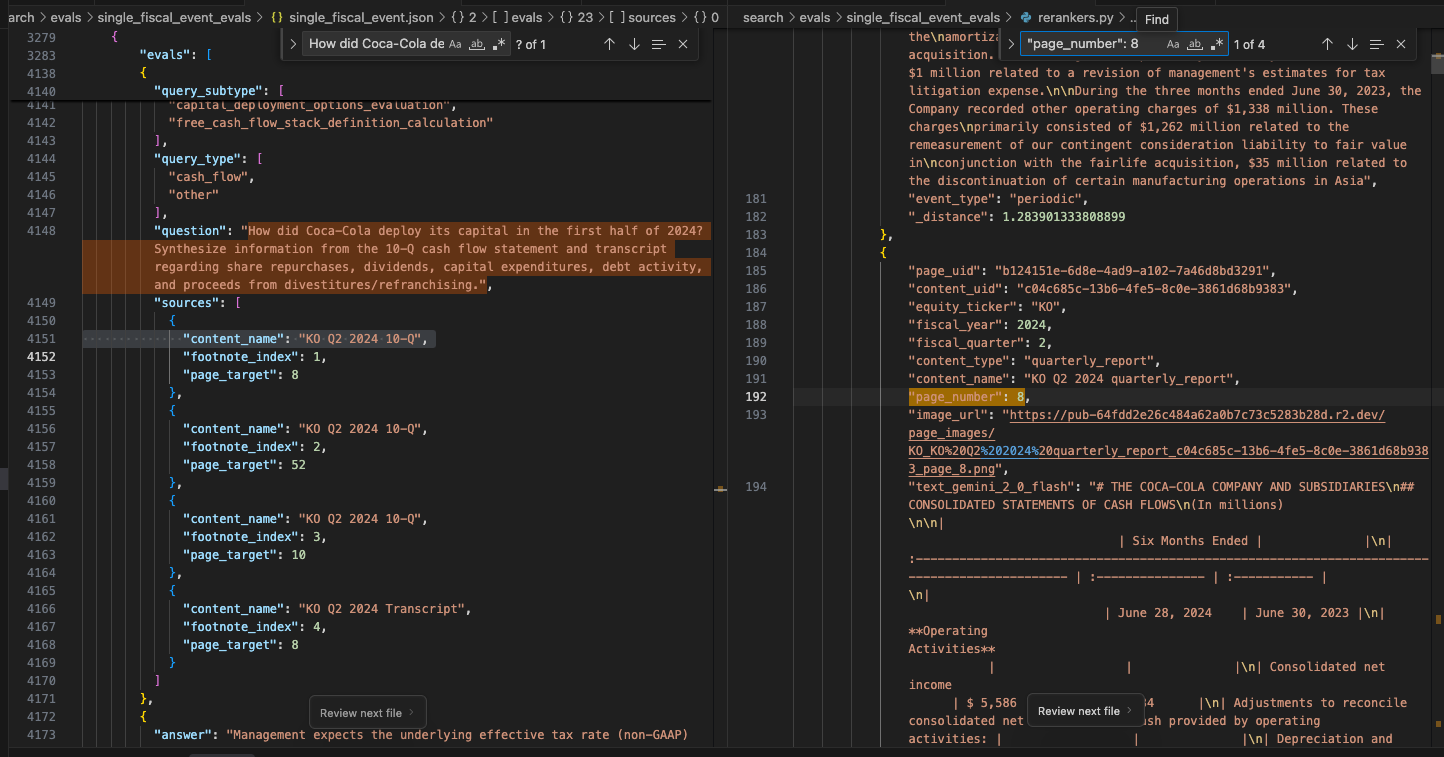
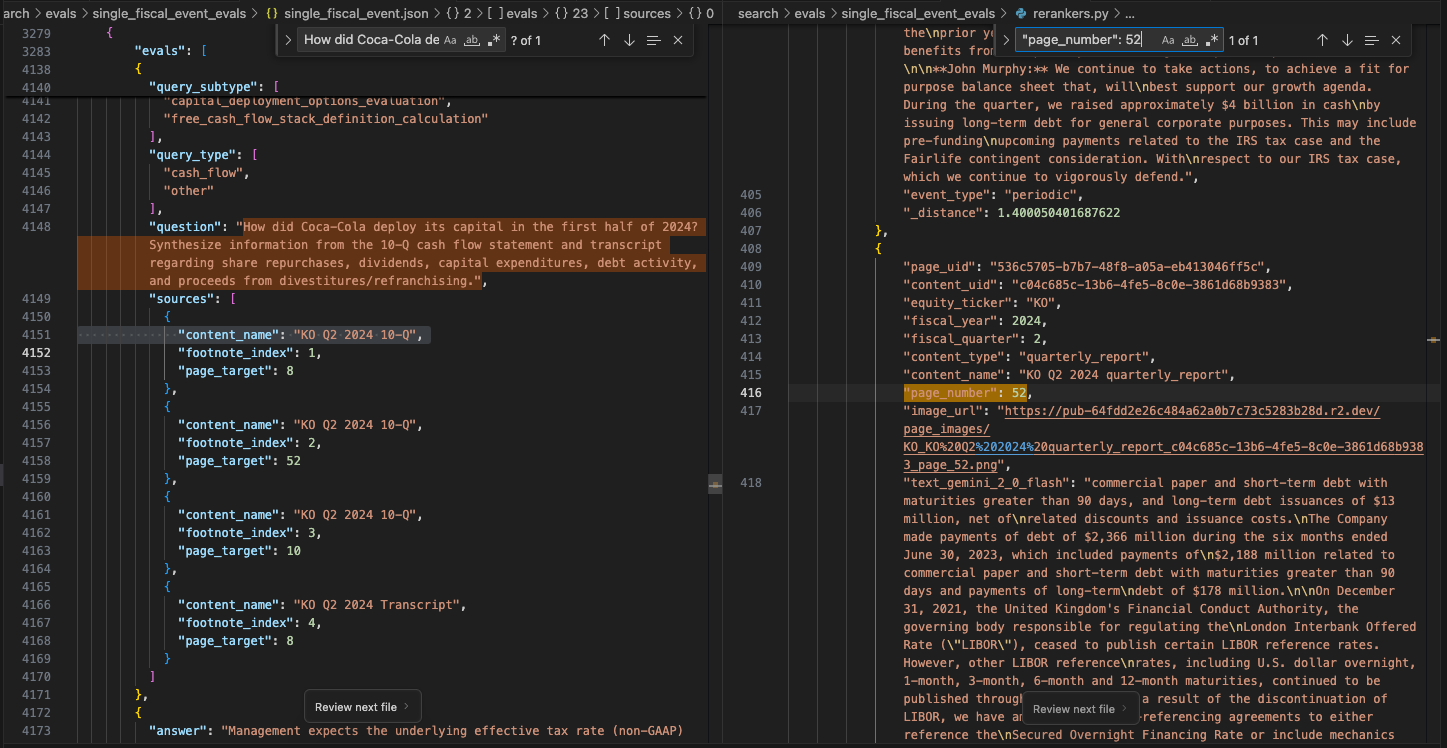
Adding reranker with a feature flag
Adding the reranker as a feature flag so only when it's optionally specified
[THIS NEEDS BETTER CONFIG BREAKDOWN]
| variant | total_top_k | rerank_top_k | avg recall | avg precision | avg latency |
|---|---|---|---|---|---|
| simple-per-content-reranker | 20 | 10 | 0.67582332 | 0.1985981308 | 65.22222813 |
| simple-per-content-reranker | 40 | 10 | 0.7701490877 | 0.2327102804 | 78.37184937 |
| simple-per-content-reranker | 60 | 10 | 0.7898642635 | 0.2401869159 | 87.72240163 |
| simple-per-content | 20 | 0 | 0.6994993324 | 0.1037383178 | 8.378678131 |
| simple-per-content | 40 | 0 | 0.8438696039 | 0.0690072143 | 9.055654558 |
| simple-per-content | 60 | 0 | 0.9055740988 | 0.05373053824 | 8.465420016 |
Note: Latency is much higher not because the reranker takes longer, it's because of some async/sync bug, as such just focus on the avg recall + avg precision first. Also hit some voyage tpm rate limits capped at 4m tkns / minute.
Comment: Recall is lower but precision is 4-5x higher, we should test on a higher total_top_k and leave more room for the reranker to filter the set e.g. 100 and 5. Although current rerankers won't support the amount of context loaded in (I think).
Theoretically, increases in initial recall will give the final reranked result to have a higher recall. Once we allow for flexibility on top_k upwards and introduce llm-as-a-reranker, it can evolve into a long context implementation (but that may be an appropriate format).
The sum of the number of tokens in the query and the number of tokens in any single document cannot exceed 16,000 for rerank-2; 8,000 for rerank-2-lite and rerank-1; and 4,000 for rerank-lite-1. - Voyage
Cohere has an even lower limit than that of 4k inputs for reranking. [TO THINK ABOUT THIS A BIT MORE]
The optimal number is one where we can get the highest recall + precision possible (former being more important) as such we can leverage an LM-as-a-reranker which offers a much larger total_top_k input to be reranked. >k will directly increase the amount of latency as now we're inputting tokens into an LMs.
Takes around 25 seconds! It's arguably faster with an lm-as-a-reranker.
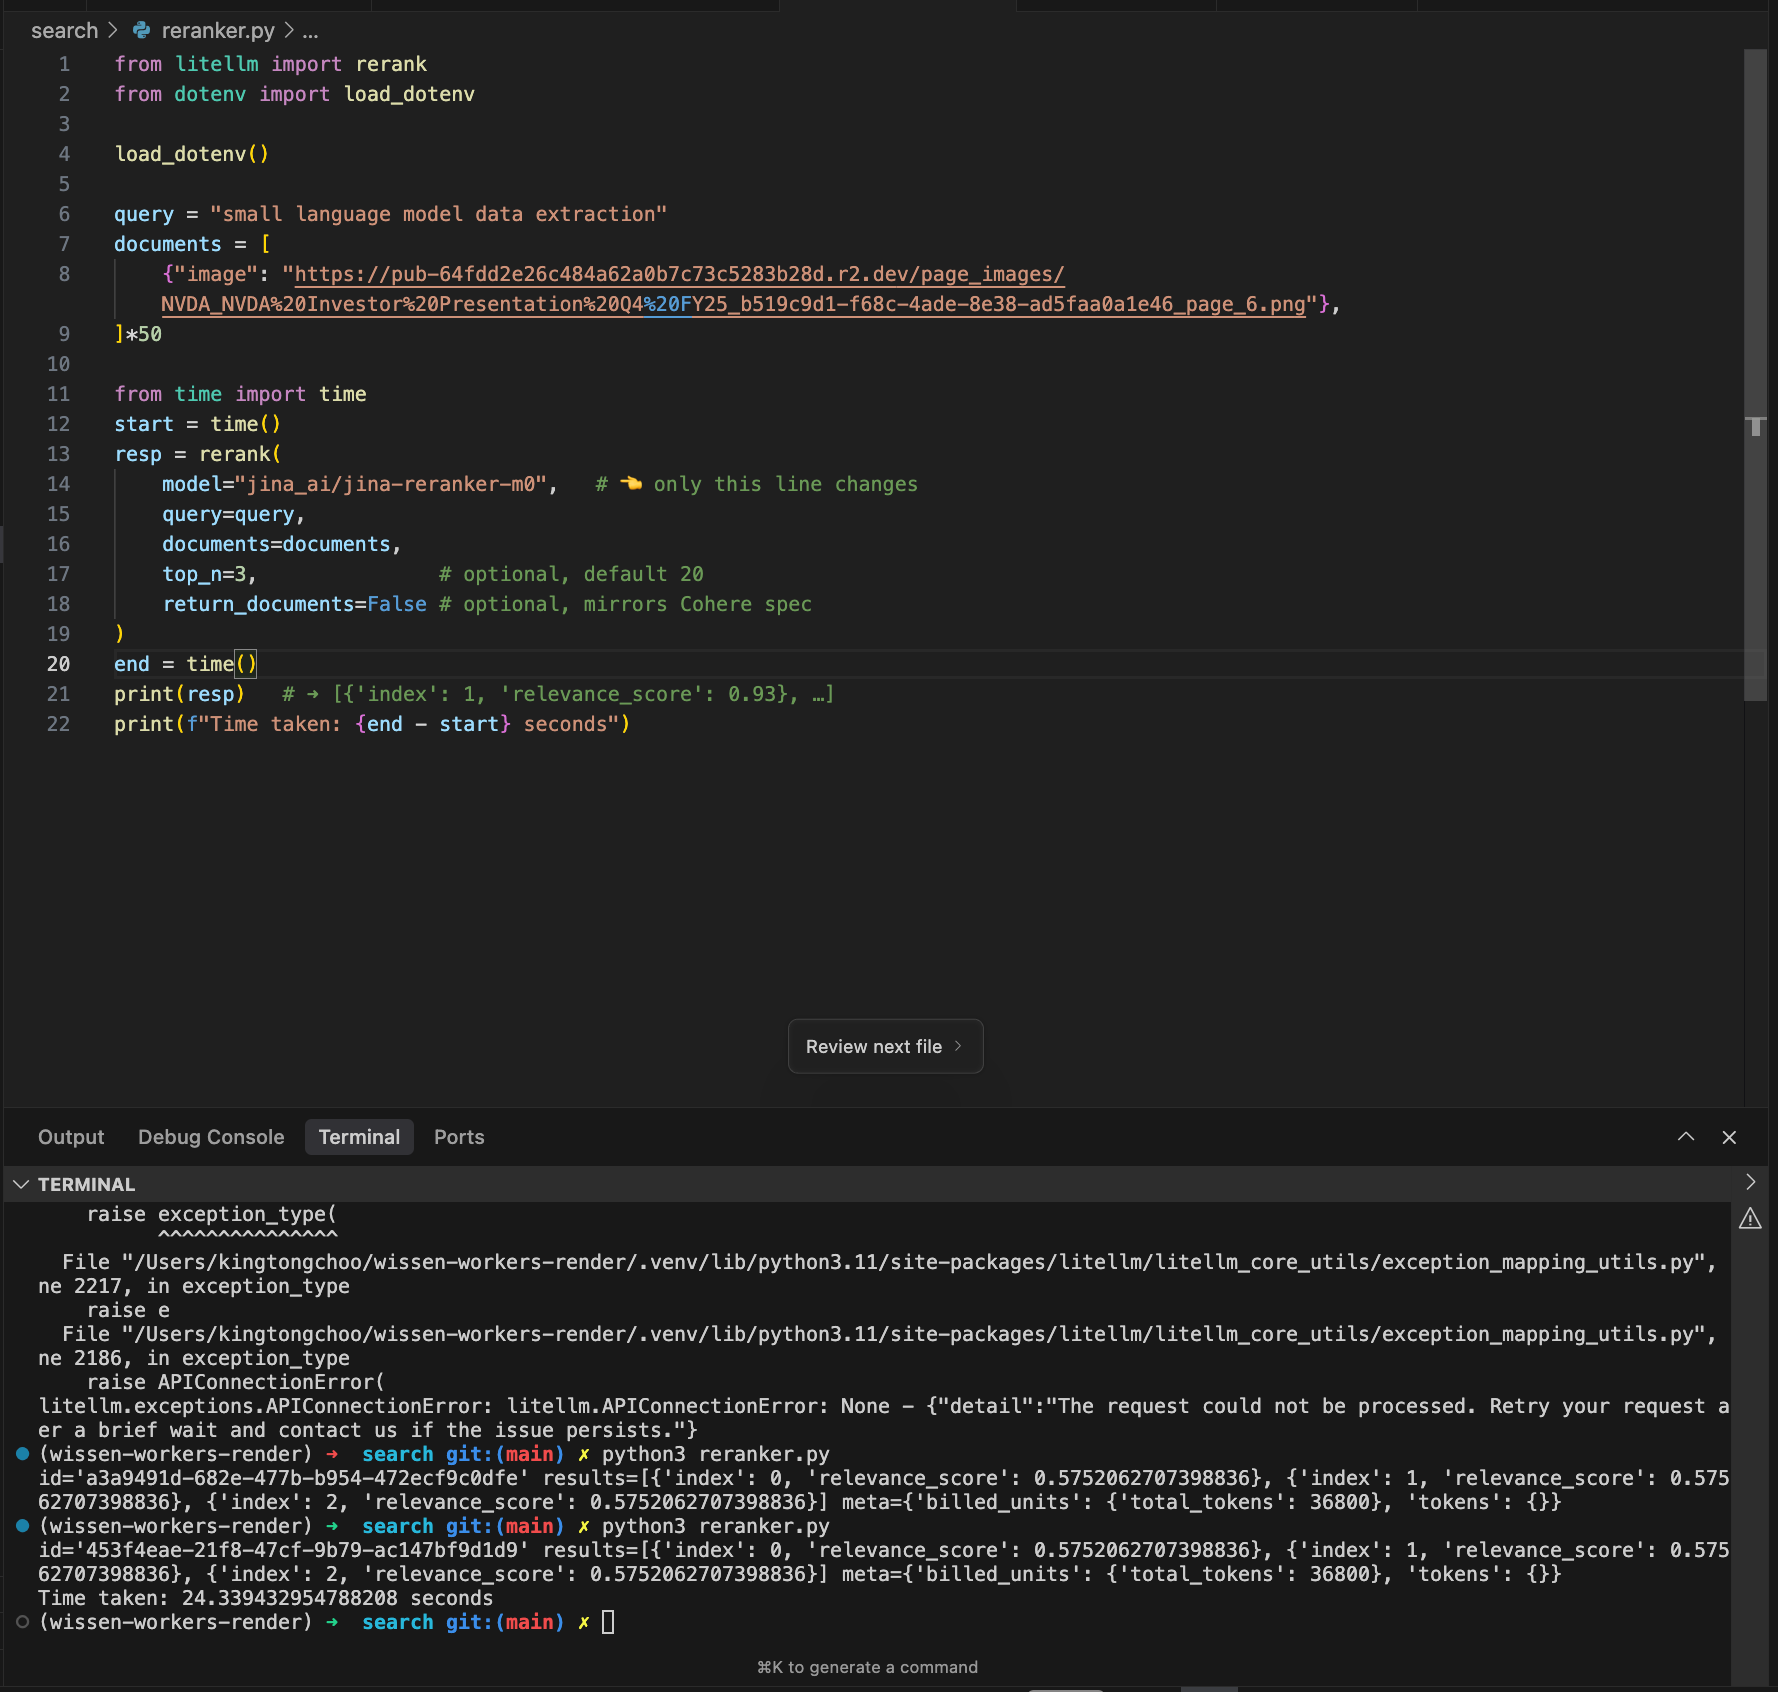
Goal: as high recall as possible whilst minimising precision issues (which can only be asserted post-generations). Arbitrarily we don't really want to return >top_k=10 as such if only initial_top_k>=60 can reach a high recall, then we need a reranker to preserve final_top_k=10
Learnt: we can fit around 3k worth of ks into the reranker, so shouldn't be an issue
The total number of tokens, defined as "the number of query tokens × the number of documents + sum of the number of tokens in all documents", cannot exceed 600K forrerank-2andrerank-2-lite, and 300K forrerank-1andrerank-lite-1. Please see our FAQ.
Going to use litellm.ai as the proxy as it simplifies the client set-up
| variant | reranking_model | initial_top_k | rerank_top_k |
|---|---|---|---|
| simple-per-content-rerank | rerank-2 |
80 | 5 |
| simple-per-content-rerank | rerank-2 |
80 | 10 |
| simple-per-content-rerank | rerank-2 |
80 | 15 |
| simple-per-content-rerank | rerank-2 |
100 | 5 |
| simple-per-content-rerank | rerank-2 |
100 | 10 |
| simple-per-content-rerank | rerank-2 |
100 | 15 |
| simple-per-content-rerank | rerank-2 |
120 | 5 |
| simple-per-content-rerank | rerank-2 |
120 | 10 |
| simple-per-content-rerank | rerank-2 |
120 | 15 |
Quick tests on cohere/rerank-v3.5 - seems to not be as good.
| variant | total_inital_top_k | reranking_model | rerank_top_k | recall | precision | latency |
|---|---|---|---|---|---|---|
| simple-per-content | 20 | cohere/rerank-v3.5 | 10 | 0.6540387183 | 0.1897196262 | 9.886601983 |
| simple-per-content | 40 | cohere/rerank-v3.5 | 10 | 0.7014686248 | 0.2044761436 | 11.32426705 |
| simple-per-content | 60 | cohere/rerank-v3.5 | 10 | 0.712305296 | 0.2081007257 | 13.41970078 |
[TODO: need to think about the search configurations a bit better]
embeddings_modelreranking_modelinitial_top_kreranker_providerreranking_modeltotal_initial_top_kreranking_top_k
Trying to run a much larger initial_top_k but hitting the following rate limit error from voyage...
12:22:33.257 Voyage AI rerank failed for model rerank-2: You have exceeded the Tokens Per Minute (TPM) rate limit of 4,...i.com/docs/rate-limits#what-happens-if-i-exceed-the-rate-limitWill revisit single fiscal_event experiments after now that we have some view on how to high high recall w/o sacrificing precision.
You can see all the experimental data in the sheets here
Other experiments we'd want to run (to dos)
What are common options that we'd want to test against
- OpenAI vector stores - then getting the embeddings on there (1 day). Set-up the experiments.
- LlamaIndex - comparison of vector benchmarks
- Perplexity Deep Research s
- OpenAI Web Search
- Exa Web Search
- Other people's comps
Setting up OpenAI to Eval Against
thoughts
- verifiability is something that is baked in considering both humans AND LMs in that case. that should be a dimension to evaluate systems.
problems
- page attribution & verifiability: very hard to know where the chunk came from from OAI to compare whether it got the right page targets
- seems not bad: it does seem to hit the 'space' - may be because with enough contents, it'll work decently well
- judging BOTH parsing & retrieval: it's important to judge both.
Appendix
SINGLE FISCAL EVENT SYNTHETIC GENERATION PROMPT
**Your Goal**
Act as an expert long/short equity analyst, trained in the rigorous analytical methods of top hedge funds like Point72 and Citadel. Your task is to generate probing, analytical questions about {equity_ticker}'s performance, strategy, and financial health based **only** on the information contained within the provided set of documents ({content_names}). Subsequently, provide comprehensive, well-supported answers by **synthesizing** information found **across multiple pages and potentially multiple documents** within the provided set. Answers must use inline numerical footnote citations (e.g., `[1]`, `[2, 3]`) linked to specific page numbers and document names defined in the JSON output's `sources` array.

**Explicitly Consider**
1.  **Company Specifics** – Focus on {equity_ticker}'s reporting structure, disclosed KPIs, strategic initiatives, management commentary, and financial details mentioned *specifically within the provided documents*.
2.  **Industry Nuances** – Consider relevant metrics, competitive dynamics, and business model characteristics pertinent to {equity_ticker}'s industry *as reflected in the company's discussions across the provided documents*.
3.  **Cross-Document Synthesis** – Actively look for connections, corroborations, or discrepancies between information presented in different documents (e.g., linking earnings call commentary to 10-K disclosures, or comparing metrics presented in an investor presentation to the official filings).

**Task:**
Generate {num_evals} insightful question-answer pairs based **only** on the {content_names} you are provided.

**Objective:** Generate sophisticated, hedge-fund-style Q&A pairs based *solely* on the provided financial documents. Adopt the mindset of a critical long/short equity analyst focusing on fundamental drivers, risks, valuation implications, and management credibility derivable *from synthesizing information across these documents alone*.

**Analytical Framework Guidance:**
* Formulate questions inspired by the following frameworks, ensuring coverage across the six primary categories:
    1.  Revenue (20%)
    2.  Margins (20%)
    3.  Balance Sheet (15%)
    4.  Cash Flow (10%)
    5.  Outlook (10%) - *Focus on management discussion, forward-looking statements, guidance (if any), and risk factors across documents.*
    6.  Other (25%) - *Including KPIs, Strategy, Risks, Competition, etc.*
* Use the primary category names (lowercase, underscore_separated: `revenue`, `margins`, `balance_sheet`, `cash_flow`, `outlook`, `other`) in the `query_type` array.
    * Include multiple `query_type` values if a Q&A pair significantly bridges concepts (e.g., analyzing revenue mix impact on gross margin warrants `["revenue", "margins"]`).
* Use the specific framework subtype names (lowercaseCamelCase, defined below) in the `query_subtype` array. Include all relevant subtypes addressed by the Q&A.
* **Important:** Treat frameworks as guides. Adapt questions to {equity_ticker}'s specifics and the data *available across the provided documents*. Verify data existence before generating questions. Prioritize insightful questions answerable *solely* from the provided documents, reading between the lines and synthesizing across sources where appropriate.

**Frameworks to Apply:**

**1) Revenue Frameworks (`query_type`: ["revenue"])**
    * **Revenue Growth Driver & KPI Analysis** (`query_subtype`: `revenue_growth_driver_kpi`)
        * **Focus Areas:** YoY growth (%, $); Management's stated drivers (volume, price, mix, M&A, FX, market factors) across documents; Trends in company-specific KPIs (subscribers, ARPU, GMV, SSS, volume, utilization, bookings, etc.) *if disclosed in any document*; Connection between KPI trends and revenue; Management's discussion on outlook/sustainability.
        * **Source:** Relevant sections across provided documents (e.g., MD&A in 10-K/Q, Earnings Call Transcript, Investor Presentation).
    * **Revenue Growth Decomposition (Price vs. Volume)** (`query_subtype`: `price_volume_decomposition`)
        * **Applicability:** Only if Price/Volume/Mix data is disclosed or directly calculable *from the provided documents*. Check feasibility.
        * **Source:** Relevant sections (e.g., MD&A, Segment notes in filings, Call transcripts).
    * **Mix Accelerator / Mix Extrapolation Analysis** (`query_subtype`: `mix_acceleration`)
        * **Applicability:** Impact of shifts between reported segments/products/geographies with different growth/economics *as detailed across the documents*.
        * **Source:** Relevant sections (e.g., Segment Reporting, MD&A, Call transcripts).
    * **Comp Waterfall / Same-Store Sales (SSS) Analysis** (`query_subtype`: `comp_waterfall`)
        * **Applicability:** Retail/restaurants primarily. Comp store growth, new store effects, *if data is present in any document*.
        * **Source:** Relevant sections (e.g., MD&A, Metrics disclosures, Press Releases, Call transcripts).
    * **Box Replicator / Basic Unit Economics (Revenue Focus)** (`query_subtype`: `box_replicator`)
        * **Applicability:** Revenue = Units * Revenue/Unit, if metrics are disclosed/derivable *from the provided documents*.
        * **Source:** Relevant sections (e.g., MD&A, Metrics disclosures, Call transcripts).
    * **Assessing Revenue Growth Durability ($ vs %)** (`query_subtype`: `revenue_growth_durability`)
        * **Applicability:** Compare YoY % vs $ growth for scale context. Needs current/prior year revenue *from the relevant filings*. Analyze commentary from other sources.
        * **Source:** Financial Statements (comparative periods in filings).
    * **Segment Revenue Analysis** (`query_subtype`: `segment_revenue`)
        * **Applicability:** Growth, contribution, profitability (if disclosed), commentary for each reported business segment *across the documents*. Synthesize filing data with call commentary.
        * **Source:** Segment Footnote, MD&A (filings), Call transcripts, Presentations.
    * **Geographic Revenue Analysis** (`query_subtype`: `geographic_revenue`)
        * **Applicability:** Growth, contribution, commentary for each reported geographic region *across the documents*.
        * **Source:** Geographic Footnote, MD&A (filings), Call transcripts, Presentations.
    * **Backlog / Deferred Revenue / RPO Analysis** (`query_subtype`: `backlog_deferred_revenue`)
        * **Applicability:** Trends in backlog/deferred revenue/Remaining Performance Obligations as future revenue indicators *based on disclosures*. Analyze growth and commentary.
        * **Source:** Balance Sheet, Revenue Footnote, MD&A (filings), Call transcripts.

**2) Margins Frameworks (`query_type`: ["margins"])**
    * **Incrementalism Framework (Specific Event Margin Impact)** (`query_subtype`: `specific_event_margin_impact`)
        * **Applicability:** Only if a discrete event's revenue/cost impact is discussed *in any document*. Interpret commentary critically.
        * **Source:** MD&A, Footnotes (filings), Call transcripts, Press releases.
    * **Fixed vs. Variable vs. Semi-Fixed Cost Analysis** (`query_subtype`: `fixed_variable_semi_fixed_cost_analysis`)
        * **Applicability:** Conceptual analysis of cost structure (COGS, SG&A, R&D) based on stated drivers (volume, inflation, headcount, investments) mentioned *across documents*. Interpret margin changes described.
        * **Source:** Financial Statements, MD&A (filings), Call transcripts.
    * **Incremental Margin Analysis (Δ Profit / Δ Revenue)** (`query_subtype`: `incremental_margin_analysis`)
        * **Applicability:** Margin on YoY change in revenue. Needs current/prior year Revenue & Profit (Gross or Operating) *from filings*. Calculate and interpret using commentary from other sources.
        * **Source:** Financial Statements (comparative periods in filings), MD&A, Call transcripts.
    * **Unit Economics Analysis (Cost/Profit Focus)** (`query_subtype`: `unit_economics_cost_profit_focus`)
        * **Applicability:** COGS, Gross Profit, Opex, Operating Profit per unit, *if data allows derivation from the provided documents*. Synthesize metrics and commentary.
        * **Source:** Financial Statements, Metrics disclosures (if available), MD&A, Call transcripts.
    * **Gross Margin Analysis** (`query_subtype`: `gross_margin_analysis`)
        * **Applicability:** YoY trends in Gross Profit & GM%. Stated drivers (pricing, input costs, mix, efficiency). Critically assess management's explanations across sources.
        * **Source:** Financial Statements, MD&A (filings), Call transcripts, Presentations.
    * **Operating Expense Analysis (SG&A, R&D)** (`query_subtype`: `operating_expense_analysis`)
        * **Applicability:** YoY trends in specific opex lines ($, % revenue). Stated drivers (headcount, marketing, stock-based comp, investments). Question efficiency, necessity, and link to strategy discussed elsewhere.
        * **Source:** Financial Statements, MD&A (filings), Call transcripts.
    * **Non-GAAP Reconciliation Analysis** (`query_subtype`: `non_gaap_reconciliation_analysis`)
        * **Applicability:** Analyze GAAP to Non-GAAP adjustments (SBC, amortization, restructuring, M&A costs) *if provided*. Magnitude, trends, consistency, and quality of adjustments. Compare disclosures across documents.
        * **Source:** Non-GAAP Reconciliations section (MD&A, Earnings Release, Presentation).

**3) Balance Sheet Frameworks (`query_type`: ["balance_sheet"])**
    * **Balance Sheet & Liquidity Analysis** (`query_subtype`: `balance_sheet_liquidity_analysis`)
        * **Applicability:** Key leverage (e.g., Debt/Equity, Net Debt if calculable), liquidity ratios (Current, Quick), debt maturities mentioned. Assess strength/risk using data and commentary.
        * **Source:** Balance Sheet, Debt Footnotes, MD&A (filings), Call transcripts. (Note: EBITDA needed for some ratios might require calculation from IS/CF).
    * **Financial Health / Risk Assessment** (`query_subtype`: `financial_health_risk_assessment`)
        * **Applicability:** Assess liquidity, cash vs potential burn (from CF), overall debt load, and solvency indicators *based on data across documents*. Identify potential stress points or hidden strengths mentioned in commentary.
        * **Source:** Balance Sheet, Cash Flow Statement, MD&A, Risk Factors (filings), Call transcripts.
    * **Capital Intensity Analysis** (`query_subtype`: `capital_intensity_analysis`)
        * **Applicability:** Capital needed (PP&E, Working Capital) relative to sales. Calculate ratios (e.g., PP&E/Sales) and analyze trends *using filing data and commentary*.
        * **Source:** Balance Sheet, Income Statement, MD&A (filings), Call transcripts.
    * **Working Capital Analysis (DSO, DIO, DPO)** (`query_subtype`: `working_capital_analysis`)
        * **Applicability:** Calculate WC turnover ratios (DSO, DIO, DPO). Analyze trends & commentary *across documents*. Question efficiency changes and management explanations.
        * **Source:** Balance Sheet, Income Statement (Sales/COGS in filings), MD&A, Call transcripts.
    * **Debt Analysis (Structure & Covenants)** (`query_subtype`: `debt_analysis_structure_covenants`)
        * **Applicability:** Debt breakdown (ST/LT, fixed/floating, maturities if disclosed), level changes, interest rate details, covenant compliance mentions *within the documents*. Assess risk associated with debt load and refinancing needs.
        * **Source:** Balance Sheet, Debt Footnote, MD&A (filings), Call transcripts.
    * **Intangibles/Goodwill Analysis** (`query_subtype`: `intangibles_goodwill_analysis`)
        * **Applicability:** Significant intangible/goodwill balances, impairment commentary/charges *detailed in the documents*. Question the carrying value, useful lives, and potential future impairments based on performance or strategy shifts.
        * **Source:** Balance Sheet, Intangibles/Goodwill Footnote, MD&A (filings), Call transcripts.

**4) Cash Flow Frameworks (`query_type`: ["cash_flow"])**
    * **Free Cash Flow (FCF) Stack Definition & Calculation** (`query_subtype`: `free_cash_flow_stack_definition_calculation`)
        * **Applicability:** Calculate OCF & FCF from CF Statement components (NI, D&A, WC Changes, SBC, Capex) *as presented in filings*. Define FCF used by management (e.g., OCF - Capex). Compare calculations/definitions if presented differently across sources.
        * **Source:** Cash Flow Statement (filings), Earnings Releases, Presentations.
    * **Capital Deployment Options Evaluation** (`query_subtype`: `capital_deployment_options_evaluation`)
        * **Applicability:** Analyze *actual* cash uses (Capex, Opex choices impacting cash, Debt changes, Dividends, Buybacks, M&A) per CF Stmt & commentary *across documents*. Critically evaluate the *efficiency, rationale, and shareholder return implications* of deployment choices mentioned.
        * **Source:** Cash Flow Statement (Investing & Financing sections in filings), MD&A, Footnotes, Call transcripts, Press releases.
    * **Cash Burn / Runway Analysis** (`query_subtype`: `cash_burn_runway_analysis`)
        * **Applicability:** Calculate FCF burn rate (if negative), estimate runway based on cash balance (BS), *using data solely from the documents*. Assess sustainability based on commentary.
        * **Source:** Cash Flow Statement, Balance Sheet (filings).
    * **Cash Conversion Cycle** (`query_subtype`: `cash_conversion_cycle`)
        * **Applicability:** Calculate CCC using DSO, DIO, DPO derived from filings. Analyze trend & drivers mentioned across documents.
        * **Source:** Balance Sheet, Income Statement (filings), MD&A, Call transcripts.
    * **Quality of Earnings Analysis (OCF vs Net Income)** (`query_subtype`: `quality_of_earnings_analysis`)
        * **Applicability:** Compare OCF to NI. Investigate major divergences explained in the CF Statement reconciliation (e.g., large WC swings, SBC, deferred taxes). Assess earnings quality and sustainability based on cash generation.
        * **Source:** Cash Flow Statement, Income Statement (filings), Call transcripts.
    * **Capex Analysis** (`query_subtype`: `capex_analysis`)
        * **Applicability:** Level & trend of Capex (CF Stmt), compare to D&A (proxy for maintenance), commentary on growth vs. maintenance *if provided across documents*. Question investment returns and link to strategic goals.
        * **Source:** Cash Flow Statement, MD&A (filings), Call transcripts, Presentations.

**5) Outlook Frameworks (`query_type`: ["outlook"])**
    * **Forward-Looking Guidance & Assumptions Analysis** (`query_subtype`: `forward_looking_guidance_assumptions`)
        * **Focus:** Analyze *any* forward-looking statements, management discussion of expectations, explicit guidance (ranges, targets), macro assumptions mentioned *across the documents*.
        * **Consider:** Scrutinize the basis, achievability, and key variables underpinning any stated expectations; identify key risks highlighted by management that could impact future results. Compare stated plans/targets to current performance and historical execution. Note changes in guidance or tone.
        * **Source:** MD&A (Outlook sections, general discussion in filings), Risk Factors (filings), Earnings Call Transcripts, Investor Presentations, Press Releases.

**6) Other Frameworks (`query_type`: ["other"])**
    * **KPI Analysis** (`query_subtype`: `kpi_analysis`)
        * **Focus:** Identify, analyze, interpret key non-financial metrics & unique business nuances *disclosed across the documents* that are critical for understanding performance.
        * **Consider:** KPI relevance/definition consistency (ARPU, SSS, load factors, bookings, customer counts); Calculation methods (MD&A/footnotes/glossaries); Linkage/sensitivity to financials; YoY trends; Qualitative context provided. Question changes, lack of disclosure, or inconsistencies.
        * **Source:** MD&A, Metrics sections, Footnotes (filings), Call transcripts, Presentations, Earnings Releases.
    * **Risk Analysis** (`query_subtype`: `risk_analysis`)
        * **Focus:** Systematically analyze the disclosed Risk Factors (10-K/Q) and management's discussion of risks (macro, competition, operational, financial, regulatory) *across all documents*.
        * **Consider:** Assess the potential *impact* and *likelihood* (implicitly) of key risks based on descriptions and emphasis. Look for changes in risk disclosures or new risks highlighted in calls/presentations. Question mitigants mentioned.
        * **Source:** Risk Factors section (filings), MD&A (filings), Call transcripts, Presentations.
    * **Strategy Analysis** (`query_subtype`: `strategy_analysis`)
        * **Focus:** Analyze stated corporate strategy, market positioning, M&A/divestiture rationale, capital allocation priorities *as described across the documents*.
        * **Consider:** Acquisition integration updates, strategic rationale provided for key decisions (e.g., investments, market entries/exits, partnerships). Critically evaluate the alignment between stated strategy and reported actions/results/capital deployment. Look for shifts in strategy.
        * **Source:** MD&A, Business section (filings), Call transcripts, Investor Presentations, Press releases.
    * **Competition Analysis** (`query_subtype`: `competition_analysis`)
        * **Focus:** Analyze any commentary *within the documents* regarding market share, competitive dynamics, differentiation, competitor actions/mentions, or industry trends.
        * **Consider:** How does management portray its competitive position and win rates? Are there mentions of pricing pressure, new entrants, or technological disruption? Synthesize commentary across sources.
        * **Source:** Business section, MD&A, Risk Factors (filings), Call transcripts, Presentations.
    * **Related Party Transactions** (`query_subtype`: `related_party_transactions`)
        * **Focus:** Scrutinize disclosures on transactions with related parties (mgmt, directors, major shareholders) *if detailed in filings*. Analyze the nature, volume, terms, and business purpose. Assess potential conflicts of interest.
        * **Source:** Related Party Transactions Footnote (filings).
    * **Qualitative Tone & Messaging Analysis** (`query_subtype`: `qualitative_tone_messaging_analysis`)
        * **Focus:** Analyze the language/tone used in MD&A, earnings call Q&A, and presentations. Look for signs of confidence/caution, transparency/opacity, changes in emphasis, defensiveness, or potential obfuscation. Compare messaging across different forums (e.g., prepared remarks vs Q&A).
        * **Consider:** Is the commentary consistent with the financial results? Are explanations clear and direct? How does management respond to tough questions?
        * **Source:** MD&A (filings), Call transcripts, Presentations.

**Answer & Citation Requirements:**
* **CRITICAL: Synthesize Across Documents:** Answers **MUST** integrate information logically connected across different pages and potentially *different documents* within the provided set ({content_names}). For example, link a statement made in an earnings call transcript ({content_name_A}) to specific financial data disclosed in a 10-K ({content_name_B}), and perhaps corroborate with a metric from an investor presentation ({content_name_C}). **Do not reference any external documents or prior knowledge.** Demonstrate comprehensive reading and synthesis *of all provided documents*.
* **Comprehensive & Analytical:** Explain the "why" and "so what" from a critical investor's perspective. Perform necessary calculations based *only* on data provided in the documents (e.g., YoY changes, margins, ratios). Focus on materiality, key drivers, potential red flags, inconsistencies, and implications for understanding the company's performance, risks, and valuation based *solely* on synthesizing these filings and transcripts.
* **Inline Footnote Citations:**
    * **Format:** Cite specific supporting evidence using inline numerical footnote markers in square brackets, starting from `[1]` for each answer. Example: `Management stated revenue growth was driven by pricing actions [1], though volume declined in the EMEA segment [2]. This aligns with the SSS metric reported in the presentation [3].`
    * **Numbering:** Footnote numbering (`1, 2, 3, ...`) **restarts at 1 for each new Answer**.
    * **Mapping:** Each footnote marker `[X]` within the answer text **must** correspond to an entry in the `sources` array for that Q&A pair, linking it to the specific `page_target` and `content_name` where the evidence is found.
    * **Accuracy:** Ensure the `page_target` and `content_name` in the `sources` array accurately reflect the page number and document name containing the cited information. This is essential for verification.

**Output JSON Structure and Format:**
* Generate a single JSON array `[` ... `]` containing {num_evals} individual Q&A pair objects.
* Each Q&A pair object **must** follow this structure precisely:

```json
{
  "question": "Your insightful, framework-driven question here, potentially referencing multiple concepts or documents...",
  "answer": "Your comprehensive, synthesized answer here, integrating information from potentially multiple documents and pages, including inline citations like [1] and [2, 3]. The answer text should flow naturally.",
  "query_type": ["category_1", "category_2"], // e.g., ["revenue", "margins"]
  "query_subtype": ["subtype_a", "subtype_b"], // e.g., ["revenue_growth_driver_kpi", "segment_revenue", "qualitative_tone_messaging_analysis"]
  "sources": [
    {
      "footnote_index": 1,
      "page_target": <page_number_where_info_for_[1]_is_found>, // Integer page number
      "content_name": "<name_of_document_for_[1]>" // String document name (e.g., "KO_10K_2023.pdf", "KO_Q4_2023_Transcript.txt")
    },
    {
      "footnote_index": 2,
      "page_target": <page_number_where_info_for_[2]_is_found>, // Integer page number
      "content_name": "<name_of_document_for_[2]>" // String document name
    },
    {
      "footnote_index": 3,
      "page_target": <page_number_where_info_for_[3]_is_found>, // Integer page number
      "content_name": "<name_of_document_for_[3]>" // String document name
    }
    // ... include an object for every footnote index used in the answer
  ]
}
SINGLE DOC SYNTHETIC GENERATION EVALUATION PROMPT
**Your Goal**
Act as an expert equity analyst from a fund like Point72 or Citadel. Your task is to generate probing, analytical questions about KO's performance and financial health based **only** on the provided document ({content_name}). Then, provide comprehensive, well-supported answers synthesizing information found on a **single page** OR **across multiple pages** within that document. Answers must use inline numerical footnote citations (e.g., `[1]`, `[2, 3]`) linked to specific page numbers defined in the JSON output's `footnotes` array.

**Explicitly Consider**
1.  **Company Specifics** – Think about KO’s reporting structure, known KPIs, strategic moves, and disclosures mentioned *specifically within this document.
2.  **Industry Nuances** – Consider relevant metrics, competitive dynamics, and typical business models in KO's industry *as reflected in the company's discussions within this document*.

**Task:**
Generate 20 question-answer pairs based **only** on the {content_name} you are provided.

**Objective:** Generate sophisticated, hedge-fund-style Q&A pairs based *solely* on the provided financial document. Adopt the mindset of a critical long/short equity analyst focusing on fundamental drivers, risks, and implications derivable *from this document alone*.

**Analytical Framework Guidance:**
* Formulate questions inspired by the following frameworks, ensuring coverage across the six primary categories:
    1.  Revenue (20%)
    2.  Margins (20%)
    3.  Balance Sheet (15%)
    4.  Cash Flow (10%)
    5.  Outlook (10%) - *Focus on management discussion, forward-looking statements, and risk factors within the document.*
    6.  Other (25%)
* Use the primary category names (lowercase, underscore_separated: `revenue`, `margins`, `balance_sheet`, `cash_flow`, `outlook`, `other`) in the `query_type` array.
    * Include multiple `query_type` values if a Q&A pair significantly bridges concepts (e.g., analyzing revenue mix impact on gross margin warrants `["revenue", "margins"]`).
* Use the specific framework subtype names (lowercaseCamelCase, defined below) in the `query_subtype` array. Include all relevant subtypes addressed by the Q&A.
* **Important:** Treat frameworks as guides. Adapt questions to {equity_ticker}'s specifics and the data *available within this single {document_type} for {year}*. Verify data existence before generating questions. Prioritize insightful questions answerable *solely* from the provided document, reading between the lines where appropriate.

**Frameworks to Apply:**

**1) Revenue Frameworks (`query_type`: ["revenue"])**
    * **Revenue Growth Driver & KPI Analysis** (`query_subtype`: `revenue_growth_driver_kpi`)
        * **Applicability:** General. Core reasons for revenue changes, linking financials to ops via disclosed metrics.
        * **Focus Areas:** YoY growth (%, $); Management's stated drivers (volume, price, product, M&A, market factors); Trends in company-specific KPIs (subscribers, ARPU, GMV, SSS, volume, utilization, bookings, etc.) *if disclosed*; Connection between KPI trends and revenue; Management's discussion on outlook/sustainability.
        * **Source:** Relevant sections within the provided document (e.g., MD&A, Financial Statements, Footnotes, Metrics disclosures).
    * **Revenue Growth Decomposition (Price vs. Volume)** (`query_subtype`: `price_volume_decomposition`)
        * **Applicability:** Only if Price/Volume data disclosed or directly calculable *within the document*. Check feasibility.
        * **Source:** Relevant sections (e.g., MD&A, Segment notes).
    * **Mix Accelerator / Mix Extrapolation Analysis** (`query_subtype`: `mix_acceleration`)
        * **Applicability:** Impact of shifts between reported segments/products with different growth/economics *as detailed in the document*.
        * **Source:** Relevant sections (e.g., Segment Reporting, MD&A).
    * **Comp Waterfall / Same-Store Sales (SSS) Analysis** (`query_subtype`: `comp_waterfall`)
        * **Applicability:** Retail/restaurants primarily. Comp store growth, new store effects, *if data is present*.
        * **Source:** Relevant sections (e.g., MD&A, Metrics disclosures).
    * **Box Replicator / Basic Unit Economics (Revenue Focus)** (`query_subtype`: `box_replicator`)
        * **Applicability:** Revenue = Units * Revenue/Unit, if metrics are disclosed/derivable *from the document*.
        * **Source:** Relevant sections (e.g., MD&A, Metrics disclosures).
    * **Assessing Revenue Growth Durability ($ vs %)** (`query_subtype`: `revenue_growth_durability`)
        * **Applicability:** Compare YoY % vs $ growth for scale context. Needs current/prior year revenue *from the document*.
        * **Source:** Financial Statements (comparative periods).
    * **Segment Revenue Analysis** (`query_subtype`: `segment_revenue`)
        * **Applicability:** Growth, contribution, profitability (if disclosed), commentary for each reported business segment *within the document*.
        * **Source:** Segment Footnote, MD&A.
    * **Geographic Revenue Analysis** (`query_subtype`: `geographic_revenue`)
        * **Applicability:** Growth, contribution, commentary for each reported geographic region *within the document*.
        * **Source:** Geographic Footnote, MD&A.
    * **Backlog / Deferred Revenue Analysis** (`query_subtype`: `backlog_deferred_revenue`)
        * **Applicability:** Trends in backlog/deferred revenue as future revenue indicators *based on disclosures*.
        * **Source:** Balance Sheet, Revenue Footnote, MD&A.

**2) Margins Frameworks (`query_type`: ["margins"])**
    * **Incrementalism Framework (Specific Event Margin Impact)** (`query_subtype`: `specific_event_margin_impact`)
        * **Applicability:** Only if a discrete event's revenue/cost impact is discussed *in the document*. Interpret commentary critically.
        * **Source:** MD&A, Footnotes.
    * **Fixed vs. Variable vs. Semi-Fixed Cost Analysis** (`query_subtype`: `fixed_variable_semi_fixed_cost_analysis`)
        * **Applicability:** Conceptual analysis of cost structure (COGS, SG&A, R&D) based on stated drivers (volume, inflation, headcount). Interpret margin changes described *in the document*.
        * **Source:** Financial Statements, MD&A.
    * **Incremental Margin Analysis (Δ Profit / Δ Revenue)** (`query_subtype`: `incremental_margin_analysis`)
        * **Applicability:** Margin on YoY change in revenue. Needs current/prior year Revenue & Profit (Gross or Operating) *from the document*. Calculate and interpret.
        * **Source:** Financial Statements (comparative periods).
    * **Unit Economics Analysis (Cost/Profit Focus)** (`query_subtype`: `unit_economics_cost_profit_focus`)
        * **Applicability:** COGS, Gross Profit, Opex, Operating Profit per unit, *if data allows derivation from the document*.
        * **Source:** Financial Statements, Metrics disclosures (if available), MD&A.
    * **Gross Margin Analysis** (`query_subtype`: `gross_margin_analysis`)
        * **Applicability:** YoY trends in Gross Profit & GM%. Stated drivers (pricing, input costs, mix). Critically assess management's explanations.
        * **Source:** Financial Statements, MD&A.
    * **Operating Expense Analysis (SG&A, R&D)** (`query_subtype`: `operating_expense_analysis`)
        * **Applicability:** YoY trends in specific opex lines ($, % revenue). Stated drivers (headcount, marketing, investments). Question the efficiency and necessity of spending.
        * **Source:** Financial Statements, MD&A.
    * **Non-GAAP Reconciliation Analysis** (`query_subtype`: `non_gaap_reconciliation_analysis`)
        * **Applicability:** Analyze GAAP to Non-GAAP adjustments (SBC, amortization, restructuring) *if provided*. Magnitude, trends, and quality of adjustments.
        * **Source:** Non-GAAP Reconciliations section (often in MD&A or Exhibits).

**3) Balance Sheet Frameworks (`query_type`: ["balance_sheet"])**
    * **Balance Sheet & Liquidity Analysis** (`query_subtype`: `balance_sheet_liquidity_analysis`)
        * **Applicability:** Key leverage (e.g., Debt/Equity, Net Debt if calculable), liquidity ratios (Current, Quick), debt maturities mentioned. Assess strength/risk.
        * **Source:** Balance Sheet, Debt Footnotes, MD&A. (Note: EBITDA needed for some ratios might require calculation from IS/CF).
    * **Financial Health / Risk Assessment** (`query_subtype`: `financial_health_risk_assessment`)
        * **Applicability:** Assess liquidity, cash vs potential burn (from CF), overall debt load, and solvency indicators *based on the document's data*. Identify potential stress points.
        * **Source:** Balance Sheet, Cash Flow Statement, MD&A, Risk Factors.
    * **Capital Intensity Analysis** (`query_subtype`: `capital_intensity_analysis`)
        * **Applicability:** Capital needed (PP&E, Working Capital) relative to sales. Calculate ratios (e.g., PP&E/Sales) and analyze trends *using document data*.
        * **Source:** Balance Sheet, Income Statement, MD&A.
    * **Working Capital Analysis (DSO, DIO, DPO)** (`query_subtype`: `working_capital_analysis`)
        * **Applicability:** Calculate WC turnover ratios (DSO, DIO, DPO). Analyze trends & commentary *within the document*. Question efficiency changes.
        * **Source:** Balance Sheet, Income Statement (Sales/COGS), MD&A.
    * **Debt Analysis (Structure & Covenants)** (`query_subtype`: `debt_analysis_structure_covenants`)
        * **Applicability:** Debt breakdown (ST/LT, maturities if disclosed), level changes, interest rate details, covenant compliance mentions *within the document*. Assess risk associated with debt load.
        * **Source:** Balance Sheet, Debt Footnote, MD&A.
    * **Intangibles/Goodwill Analysis** (`query_subtype`: `intangibles_goodwill_analysis`)
        * **Applicability:** Significant intangible/goodwill balances, impairment commentary/charges *detailed in the document*. Question the carrying value and potential future impairments.
        * **Source:** Balance Sheet, Intangibles/Goodwill Footnote, MD&A.

**4) Cash Flow Frameworks (`query_type`: ["cash_flow"])**
    * **Free Cash Flow (FCF) Stack Definition & Calculation** (`query_subtype`: `free_cash_flow_stack_definition_calculation`)
        * **Applicability:** Calculate OCF & FCF from CF Statement components (NI, D&A, WC Changes, Capex) *as presented*. Define FCF (e.g., OCF - Capex).
        * **Source:** Cash Flow Statement.
    * **Capital Deployment Options Evaluation** (`query_subtype`: `capital_deployment_options_evaluation`)
        * **Applicability:** Analyze *actual* cash uses (Capex, Opex choices impacting cash, Debt changes, Dividends, Buybacks, M&A) per CF Stmt & commentary. Critically evaluate the *efficiency and rationale* of deployment choices mentioned.
        * **Source:** Cash Flow Statement (Investing & Financing sections), MD&A, Footnotes.
    * **Cash Burn / Runway Analysis** (`query_subtype`: `cash_burn_runway_analysis`)
        * **Applicability:** Calculate FCF burn rate (if negative), estimate runway based on cash balance (BS), *using data solely from the document*. Assess sustainability.
        * **Source:** Cash Flow Statement, Balance Sheet.
    * **Cash Conversion Cycle** (`query_subtype`: `cash_conversion_cycle`)
        * **Applicability:** Calculate CCC using DSO, DIO, DPO derived from the document. Analyze trend & drivers mentioned.
        * **Source:** Balance Sheet, Income Statement.
    * **Quality of Earnings Analysis (OCF vs Net Income)** (`query_subtype`: `quality_of_earnings_analysis`)
        * **Applicability:** Compare OCF to NI. Investigate major divergences explained in the CF Statement reconciliation (e.g., large WC swings, SBC). Assess earnings quality.
        * **Source:** Cash Flow Statement, Income Statement.
    * **Capex Analysis** (`query_subtype`: `capex_analysis`)
        * **Applicability:** Level & trend of Capex (CF Stmt), compare to D&A (proxy for maintenance), commentary on growth vs. maintenance *if provided*. Question investment returns.
        * **Source:** Cash Flow Statement, MD&A.

**5) Outlook Frameworks (`query_type`: ["outlook"])**
    * **Forward-Looking Guidance & Assumptions Analysis** (`query_subtype`: `forward_looking_guidance_assumptions`)
        * **Focus:** Analyze *any* forward-looking statements, management discussion of expectations, macro assumptions mentioned, or explicit guidance *within this document*.
        * **Consider:** Scrutinize the basis for any stated expectations; identify key risks highlighted by management that could impact future results. Compare stated plans/targets to current performance.
        * **Source:** MD&A (Outlook sections, general discussion), Risk Factors.

**6) Other Frameworks (`query_type`: ["other"])**
    * **KPI Analysis** (`query_subtype`: `kpi_analysis`)
        * **Focus:** Identify, analyze, interpret key non-financial metrics & unique business nuances *disclosed in the document* that are critical for understanding performance.
        * **Consider:** KPI relevance/definition (ARPU, SSS, load factors, bookings); Calculation methods (MD&A/footnotes); Linkage/sensitivity to financials; YoY trends; Qualitative context provided. Question changes or lack of disclosure.
        * **Source:** MD&A, Metrics sections, Footnotes.
    * **Risk Analysis** (`query_subtype`: `risk_analysis`)
        * **Focus:** Systematically analyze the disclosed Risk Factors and management's discussion of risks (macro, competition, operational, financial).
        * **Consider:** Assess the potential *impact* and *likelihood* (implicitly) of key risks based on the description. Look for changes in risk disclosures vs. prior periods (if discernible from context). Question mitigants mentioned.
        * **Source:** Risk Factors section, MD&A.
    * **Strategy Analysis** (`query_subtype`: `strategy_analysis`)
        * **Focus:** Analyze stated corporate strategy, market positioning, M&A/divestiture rationale *as described in the document*.
        * **Consider:** Acquisition integration updates, strategic rationale provided for key decisions (e.g., investments, market entries/exits). Critically evaluate the alignment between stated strategy and reported actions/results.
        * **Source:** MD&A, Business section, Footnotes (e.g., Acquisitions).
    * **Competition Analysis** (`query_subtype`: `competition_analysis`)
        * **Focus:** Analyze any commentary *within the document* regarding market share, competitive dynamics, differentiation, competitor actions, or industry trends.
        * **Consider:** How does management portray its competitive position? Are there mentions of pricing pressure or new entrants?
        * **Source:** Business section, MD&A, Risk Factors.
    * **Related Party Transactions** (`query_subtype`: `related_party_transactions`)
        * **Focus:** Scrutinize disclosures on transactions with related parties (mgmt, directors, major shareholders). Analyze the nature, volume, terms, and business purpose. Assess potential conflicts of interest.
        * **Source:** Related Party Transactions Footnote.
    * **Qualitative Tone & Messaging Analysis** (`query_subtype`: `qualitative_tone_messaging_analysis`)
        * **Focus:** Analyze the language/tone used in the MD&A and other narrative sections. Look for signs of confidence/caution, transparency, changes in emphasis, or potential obfuscation. (Note: Highly subjective and limited without a transcript).
        * **Consider:** Is the commentary consistent with the financial results? Are explanations clear and direct?
        * **Source:** MD&A, Business Description, Risk Factors, Footnote commentary.

**Answer & Citation Requirements:**
* **CRITICAL: Synthesize Within the Document:** Answers **MUST** integrate information logically connected across different parts (sections/pages) of the *single provided document*. For example, link a Balance Sheet item to a Cash Flow activity and related MD&A commentary. **Do not reference any external documents or prior knowledge.** Demonstrate comprehensive reading *of this document*.
* **Comprehensive & Analytical:** Explain the "why" and "so what" from a critical investor's perspective. Perform necessary calculations based *only* on data provided in the document (e.g., YoY changes, margins, ratios). Focus on materiality, key drivers, potential red flags, and implications for understanding the company's performance and risks based *solely* on this filing.
* **Inline Footnote Citations:**
    * **Format:** Cite specific supporting evidence using inline numerical footnote markers in square brackets, starting from `[1]` for each answer. Example: `The company highlighted growth in emerging markets [1]. This was partially offset by currency headwinds [2, 3].`
    * **Numbering:** Footnote numbering (`1, 2, 3, ...`) **restarts at 1 for each new Answer**.
    * **Mapping:** Each footnote marker `[X]` within the answer text **must** correspond to an entry in the `footnotes` array for that Q&A pair, linking it to the specific page number where the evidence is found.
    * **Accuracy:** Ensure the `page_target` in the `footnotes` array accurately reflects the page number containing the cited information. This is essential for verification.

**Output JSON Structure and Format:**
* Generate a single JSON array `[` ... `]` containing {num_evals} individual Q&A pair objects.
* Each Q&A pair object **must** follow this structure precisely:

```json
{
  "question": "Your insightful, framework-driven question here...",
  "answer": "Your comprehensive, synthesized answer here, including inline citations like [1] and [2, 3]. The answer text should flow naturally.",
  "query_type": ["category_1", "category_2"], // e.g., ["revenue", "margins"]
  "query_subtype": ["subtype_a", "subtype_b"], // e.g., ["revenue_growth_driver_kpi", "gross_margin_analysis"]
  "footnotes": [
    {
      "footnote_index": 1,
      "page_target": <page_number_where_info_for_[1]_is_found> // Integer page number
    },
    {
      "footnote_index": 2,
      "page_target": <page_number_where_info_for_[2]_is_found> // Integer page number
    },
    {
      "footnote_index": 3,
      "page_target": <page_number_where_info_for_[3]_is_found> // Integer page number
    }
    // ... include an object for every footnote index used in the answer
  ]
}
Consumer Analyst Group of New York Conference 2025 - February 18, 2025 Evals
{
	"content_uid": "ed46c558-0146-4f68-92a0-9712f1fad277"
	"content_name": "Consumer Analyst Group of New York Conference 2025 - February 18, 2025"
	"evals": [{
			"answer": "KO reported 12% organic revenue growth (Non-GAAP) in 2024 [1], significantly exceeding its long-term growth target of 4-6% [2] and the 2025 guidance of 5-6% [3]. While the presentation doesn't explicitly break down 2024 growth into price/mix vs. volume beyond stating +1% volume growth [1], the significant gap between 12% organic revenue and 1% volume growth strongly implies that price/mix was the dominant driver in 2024. This is consistent with external headlines cited, such as \"Coca-Cola sales rise despite surging prices\" [4]. The sustainability of this level of growth is questionable given the lower long-term targets and 2025 guidance, suggesting 2024 benefited from significant pricing actions that may not be repeatable at the same magnitude. The company aims for consistent organic revenue growth ahead of CPG peers, citing a +9% 5-year average [5].",
			"query": "Coca-Cola reported 12% organic revenue growth in 2024, well above its long-term target of 4-6% and 2025 guidance of 5-6%. What drove this outperformance relative to targets, specifically regarding price/mix versus the reported 1% volume growth, and how sustainable is this level of growth based on the information provided?",
			"query_sub_type": [
				"revenue_growth_driver_kpi",
				"price_volume_decomposition",
				"revenue_growth_durability",
				"forward_looking_guidance_assumptions"
			],
			"query_type": [
				"revenue",
				"outlook"
			],
			"sources": [{
					"footnote_index": 1,
					"page_target": 9
				},
				{
					"footnote_index": 2,
					"page_target": 10
				},
				{
					"footnote_index": 3,
					"page_target": 10
				},
				{
					"footnote_index": 4,
					"page_target": 9
				},
				{
					"footnote_index": 5,
					"page_target": 24
				}
			]
		},
		{
			"answer": "KO achieved a 30.0% Comparable Operating Margin (Non-GAAP) in 2024, representing approximately 350bps of expansion compared to 26.5% in 2017 [1, 2]. Key levers identified for improving efficiency and driving margin expansion include Revenue Growth Management, Marketing Effectiveness, Trade Promotion Optimization, creating a \"Future Ready\" Supply Chain, fostering a Continuous Productivity Mindset, and making Smart Capital Investments [1]. Specific examples of progress include a 4% improvement in SG&A as a percentage of Net Revenues between 2019 and 2024, and a 5% improvement in Marketing Effectiveness (measured as Gross Profit/Ad Spend) over the same period [3]. This margin performance from 2017 to 2024 is explicitly stated to be outperforming CPG peers [1].",
			"query": "Management highlights a ~350bps expansion in Comparable Operating Margin from 26.5% in 2017 to 30.0% in 2024. What specific efficiency levers and productivity improvements detailed in the presentation contributed to this margin expansion, and how does this performance compare to CPG peers according to the document?",
			"query_sub_type": [
				"gross_margin_analysis",
				"operating_expense_analysis",
				"incremental_margin_analysis",
				"competition_analysis",
				"strategy_analysis"
			],
			"query_type": [
				"margins",
				"other"
			],
			"sources": [{
					"footnote_index": 1,
					"page_target": 25
				},
				{
					"footnote_index": 2,
					"page_target": 41
				},
				{
					"footnote_index": 3,
					"page_target": 26
				}
			]
		},
		{
			"answer": "KO reported a 2024 Net Debt Leverage (Non-GAAP) of 1.8x Comparable EBITDA (Non-GAAP) [1, 2]. The company targets a Net Debt Leverage range of 2.0x to 2.5x [1, 3]. An upcoming fairlife contingent consideration payment, estimated at $6.1 billion and expected in 2025 [4, 5], will impact this leverage. Including this payment pro-forma against 2024 Comparable EBITDA increases the leverage ratio to 2.1x [2], which falls within the lower end of the target range. This suggests the company has structured its balance sheet to accommodate this payment while remaining within its desired leverage profile. KO maintains ample debt capacity, calculated at $12.6 billion relative to the high end (2.5x) of its target leverage range based on 2024 figures [2].",
			"query": "KO's 2024 Net Debt Leverage was 1.8x, below its target range of 2.0x to 2.5x. How does the upcoming fairlife contingent consideration payment, mentioned in the context of 2025 FCF guidance and leverage charts, impact this ratio relative to the target range, and what does this imply about the company's capacity for future actions?",
			"query_sub_type": [
				"balance_sheet_liquidity_analysis",
				"debt_analysis_structure_covenants",
				"financial_health_risk_assessment",
				"forward_looking_guidance_assumptions"
			],
			"query_type": [
				"balance_sheet",
				"outlook"
			],
			"sources": [{
					"footnote_index": 1,
					"page_target": 28
				},
				{
					"footnote_index": 2,
					"page_target": 48
				},
				{
					"footnote_index": 3,
					"page_target": 35
				},
				{
					"footnote_index": 4,
					"page_target": 10
				},
				{
					"footnote_index": 5,
					"page_target": 40
				}
			]
		},
		{
			"answer": "KO generated $10.8 billion in Free Cash Flow (FCF) in 2024, excluding the $6.041 billion IRS Tax Litigation Deposit [1, 2]. This underlying FCF funded $8.359 billion in dividends [3] and $1.1 billion in net share repurchases (calculated as $0.747B issuances less $1.795B purchases and $0.007B net change in receivables) [4, 5]. The dividend represented 73% of Adjusted Free Cash Flow in 2024 [6, 7]. KO emphasizes its consistent capital return, noting 62 consecutive years of dividend growth and 103 years of payments [8]. For 2025, projected FCF is $9.5B, excluding the fairlife contingent consideration payment [9]. This suggests continued capacity for dividends and potentially moderated buybacks while managing debt ( ~$15B due in next 5 years [10]) and investing ($2.1B Capex in 2024 [8]). The long-term Adjusted FCF Conversion Ratio target is 90-95% [11], compared to 93% achieved in 2024 [6].",
			"query": "How did Coca-Cola balance its capital allocation priorities in 2024, specifically regarding dividends (62 years of growth), share repurchases, and investments, given the reported $10.8B Free Cash Flow (excluding the IRS deposit)? How does the 2025 FCF outlook of $9.5B (excluding fairlife payment) potentially influence this balance?",
			"query_sub_type": [
				"free_cash_flow_stack_definition_calculation",
				"capital_deployment_options_evaluation",
				"forward_looking_guidance_assumptions",
				"balance_sheet_liquidity_analysis"
			],
			"query_type": [
				"cash_flow",
				"balance_sheet",
				"outlook"
			],
			"sources": [{
					"footnote_index": 1,
					"page_target": 9
				},
				{
					"footnote_index": 2,
					"page_target": 38
				},
				{
					"footnote_index": 3,
					"page_target": 44
				},
				{
					"footnote_index": 4,
					"page_target": 30
				},
				{
					"footnote_index": 5,
					"page_target": 52
				},
				{
					"footnote_index": 6,
					"page_target": 27
				},
				{
					"footnote_index": 7,
					"page_target": 43
				},
				{
					"footnote_index": 8,
					"page_target": 29
				},
				{
					"footnote_index": 9,
					"page_target": 10
				},
				{
					"footnote_index": 10,
					"page_target": 30
				},
				{
					"footnote_index": 11,
					"page_target": 31
				}
			]
		},
		{
			"answer": "The \"Studio X\" factor is presented as enhancing KO's execution capabilities at scale. Quantifiable benefits cited include 1.4x faster speed, +10% effectiveness, and +20% efficiency versus service agreement benchmarks [1]. It enabled the creation of ~200,000 assets in 150+ languages [1]. Specific examples linked to Studio X include a 13% increase in Diet Coke's overall conversation (comparing Oct 1-16 2023 vs 2024) following the Dua Lipa campaign, which leveraged Studio X for rapid digital asset deployment (e.g., 12-hour turnaround) [1]. Furthermore, Studio X connects 9 operating units, fostering end-to-end consumer centricity [2]. This infrastructure supports initiatives like global campaigns (Fanta Halloween), digital integration (Coca-Cola + Marvel), and retail execution (ShopX) [1, 3].",
			"query": "The presentation highlights \"Studio X\" as a key factor in execution. Based on the metrics provided (speed, effectiveness, efficiency, asset creation), how does Studio X tangibly contribute to Coca-Cola's operational performance and marketing campaigns, citing specific examples like the Diet Coke/Dua Lipa initiative?",
			"query_sub_type": [
				"kpi_analysis",
				"strategy_analysis",
				"operating_expense_analysis"
			],
			"query_type": [
				"other",
				"margins"
			],
			"sources": [{
					"footnote_index": 1,
					"page_target": 17
				},
				{
					"footnote_index": 2,
					"page_target": 16
				},
				{
					"footnote_index": 3,
					"page_target": 18
				}
			]
		},
		{
			"answer": "KO's strategy involves growing its portfolio through a combination of organic creation and acquisitions ('bolt-ons'). Of the 30 billion-dollar brands highlighted, 15 were created organically (e.g., Coca-Cola, Fanta, Sprite, Powerade, Dasani) [1]. Three billion-dollar brands were added via acquisition (Simply, Minute Maid Pulpy, Innocent - though Innocent is not explicitly shown on the 2024 brand slide but implied historically) [1, historical context inferred]. A significant 12 billion-dollar brands were created *after* acquisition, indicating a strategy of acquiring platforms or brands and scaling them significantly (e.g., fairlife, Costa, Topo Chico, BodyArmor) [1]. Acquired brands since 2016 are credited with driving ~25% of EPS growth, excluding borrowing costs [2]. This demonstrates a balanced approach, leveraging internal innovation while actively using M&A and subsequent investment to accelerate growth and enter new categories.",
			"query": "Coca-Cola showcases 30 billion-dollar brands. Analyze the contribution of organic brand creation versus acquisitions ('bolt-ons') in building this portfolio, based on the provided breakdown. How significant has the M&A strategy been for growth according to the presentation?",
			"query_sub_type": [
				"strategy_analysis",
				"revenue_growth_driver_kpi",
				"kpi_analysis"
			],
			"query_type": [
				"other",
				"revenue"
			],
			"sources": [{
					"footnote_index": 1,
					"page_target": 13
				},
				{
					"footnote_index": 2,
					"page_target": 30
				}
			]
		},
		{
			"answer": "The presentation outlines several key risks in the Forward-Looking Statements section [1]. Pertinent risks include: unfavorable economic and geopolitical conditions (conflicts mentioned); increased competition; inability to succeed in innovation; changes in retail landscape/loss of key customers; supply chain disruptions (commodity/input costs); integration of acquired businesses; evolving consumer preferences (health concerns, non-nutritive sweeteners); failure to digitalize; brand image damage; bottling partner relationships/financial health; tax law changes/disputes (ongoing IRS dispute mentioned); regulatory changes (packaging, labeling, ingredients); foreign currency fluctuations; interest rate increases; cybersecurity incidents; and sustainability/environmental concerns (packaging, water scarcity, climate change) [1]. The 2025 guidance, particularly the gap between 8-10% comparable currency neutral EPS growth and 2-3% comparable EPS growth [2], highlights the significant expected impact of foreign currency fluctuations, a specifically enumerated risk [1].",
			"query": "Reviewing the Forward-Looking Statements, what are the most significant risks Coca-Cola highlights that could potentially derail its performance and prevent it from achieving its 2025 guidance or long-term growth objectives? Which specific risk appears most impactful based on the 2025 EPS guidance differential?",
			"query_sub_type": [
				"risk_analysis",
				"forward_looking_guidance_assumptions"
			],
			"query_type": [
				"other",
				"outlook"
			],
			"sources": [{
					"footnote_index": 1,
					"page_target": 2
				},
				{
					"footnote_index": 2,
					"page_target": 10
				}
			]
		},
		{
			"answer": "KO's non-sparkling portfolio has significantly expanded, nearly doubling its retail value over the decade from 2014 to 2024, growing from approximately $40B (estimated visually) to $80B [1]. Key category leadership positions highlighted include being the #1 Global Player in Water (brands like Dasani, Ciel, Smartwater, Topo Chico, Vitaminwater) and Juice (Minute Maid, Simply, Del Valle, Maaza) based on 2024 retail value/value share [1]. The company also claims the #1 International Sports Drink Brand position with Powerade (outside the U.S.) [1]. The RTD Tea category showed 5% volume growth in 2024 [1]. Fairlife Core Power protein shakes are noted as 'exploding' at US retail [2], contributing to the $4B+ retail value for the Fairlife/Core Power brands in 2024 [1]. This demonstrates substantial growth and market share gains in key non-sparkling categories.",
			"query": "The presentation emphasizes growth beyond sparkling beverages. How has the retail value of Coca-Cola's non-SSD portfolio evolved over the past decade, and what specific category leadership positions or growth metrics does the company claim within Water, Juice, Sports Drinks, Tea, and emerging areas like Protein Shakes?",
			"query_sub_type": [
				"revenue_growth_driver_kpi",
				"segment_revenue",
				"strategy_analysis",
				"kpi_analysis"
			],
			"query_type": [
				"revenue",
				"other"
			],
			"sources": [{
					"footnote_index": 1,
					"page_target": 15
				},
				{
					"footnote_index": 2,
					"page_target": 9
				}
			]
		},
		{
			"answer": "KO's Return on Invested Capital (ROIC), a Non-GAAP measure defined as Comparable NOPAT divided by average invested capital [1, 2], improved significantly from 17% (16.7% calculated) in 2015 to 23% (23.1% calculated) in 2024 [3, 4]. This improvement occurred alongside a major strategic shift involving bottler refranchising, which increased KO's Net Revenue Contribution Excluding Bottling Investments from 48% in 2015 to 87% in 2024 [3]. This suggests the refranchising strategy, which generated $18B in gross pre-tax proceeds since 2015 [5], has successfully transitioned the company to a more capital-light model, boosting ROIC despite ongoing investments and acquisitions.",
			"query": "How has Coca-Cola's Return on Invested Capital (ROIC) trended between 2015 and 2024, and how does this trend relate to the company's major strategic initiatives like bottler refranchising mentioned in the presentation?",
			"query_sub_type": [
				"strategy_analysis",
				"capital_intensity_analysis",
				"kpi_analysis"
			],
			"query_type": [
				"other",
				"balance_sheet"
			],
			"sources": [{
					"footnote_index": 1,
					"page_target": 29
				},
				{
					"footnote_index": 2,
					"page_target": 35
				},
				{
					"footnote_index": 3,
					"page_target": 28
				},
				{
					"footnote_index": 4,
					"page_target": 46
				},
				{
					"footnote_index": 5,
					"page_target": 30
				}
			]
		},
		{
			"answer": "KO's Free Cash Flow (FCF), defined as net cash from operating activities less PPE purchases (Non-GAAP) [1], shows an upward trend over the period presented, albeit with some volatility. FCF was $6.1B in 2018, $8.4B in 2019, $8.7B in 2020, $11.3B in 2021, $9.5B in 2022, and $9.7B in 2023 [2]. The 2024 reported FCF was $4.7B, significantly impacted by a $6.0B IRS tax litigation deposit; excluding this, 2024 FCF was $10.8B [3, 4]. The Adjusted FCF Conversion Ratio (Adjusted FCF / Adjusted Net Income, Non-GAAP) [5] was 93% in 2024 [6], aligning with the long-term target of 90-95% [7]. This indicates strong underlying cash generation capability despite fluctuations and one-off items.",
			"query": "Analyze the trend in Coca-Cola's Free Cash Flow (FCF) generation from 2018 to 2024, considering the impact of the 2024 IRS Tax Litigation Deposit. How does the 2024 Adjusted FCF Conversion Ratio compare to the company's long-term target?",
			"query_sub_type": [
				"free_cash_flow_stack_definition_calculation",
				"quality_of_earnings_analysis",
				"cash_conversion_cycle"
			],
			"query_type": [
				"cash_flow"
			],
			"sources": [{
					"footnote_index": 1,
					"page_target": 34
				},
				{
					"footnote_index": 2,
					"page_target": 42
				},
				{
					"footnote_index": 3,
					"page_target": 27
				},
				{
					"footnote_index": 4,
					"page_target": 38
				},
				{
					"footnote_index": 5,
					"page_target": 34
				},
				{
					"footnote_index": 6,
					"page_target": 43
				},
				{
					"footnote_index": 7,
					"page_target": 31
				}
			]
		},
		{
			"answer": "KO's capital expenditure (Capex) was $2.1 billion in 2024, representing 4.4% of Net Revenues [1]. This is an increase from $1.9 billion (4.0% of Net Revenues) in 2023, $1.5 billion (3.5%) in 2022, and $1.4 billion (3.5%) in 2021 [1]. While the presentation doesn't explicitly break down Capex into maintenance vs. growth, the increasing trend in both absolute dollars and as a percentage of revenue suggests ongoing investment in the business. This spending supports the company's vast infrastructure, including ~3,000 production lines and ~14,000,000 units of cold-drink equipment [2], and aligns with strategic priorities like optimizing the KO ecosystem and smart capital investments [3, 4].",
			"query": "How has Coca-Cola's capital expenditure (Capex) trended from 2021 to 2024, both in absolute terms and as a percentage of net revenues? What does this trend suggest about the company's investment priorities?",
			"query_sub_type": [
				"capex_analysis",
				"capital_intensity_analysis",
				"strategy_analysis"
			],
			"query_type": [
				"cash_flow",
				"balance_sheet",
				"other"
			],
			"sources": [{
					"footnote_index": 1,
					"page_target": 29
				},
				{
					"footnote_index": 2,
					"page_target": 8
				},
				{
					"footnote_index": 3,
					"page_target": 12
				},
				{
					"footnote_index": 4,
					"page_target": 25
				}
			]
		},
		{
			"answer": "KO presents its franchise model as creating superior value, evidenced by a Coca-Cola System Estimated Market Cap of over $400 billion [1]. This system involves approximately 6,000,000 people servicing the network, 120,000 suppliers, 3,000 production lines, 5,000 warehouses, 30,000 red trucks, and 14,000,000 units of cold-drink equipment, serving 2.2 billion servings per day across ~33 million customer outlets [1, 2]. A key strategic element has been refranchising company-owned bottling operations, largely completed since 2015, generating $18B in gross proceeds [1, 3]. This shift increased KO's Net Revenue Contribution Excluding Bottling Investments from 48% in 2015 to 87% in 2024 [4], contributing to a more capital-light model and improved ROIC [4]. Maintaining good relationships with bottling partners and their financial health are noted as key risks [5].",
			"query": "The presentation emphasizes the franchise model as a source of superior value. Describe the scale of the Coca-Cola system as presented (people, assets, reach) and explain how the refranchising strategy since 2015 has altered the company's financial model and contribution mix.",
			"query_sub_type": [
				"strategy_analysis",
				"kpi_analysis",
				"risk_analysis"
			],
			"query_type": [
				"other"
			],
			"sources": [{
					"footnote_index": 1,
					"page_target": 8
				},
				{
					"footnote_index": 2,
					"page_target": 7
				},
				{
					"footnote_index": 3,
					"page_target": 30
				},
				{
					"footnote_index": 4,
					"page_target": 28
				},
				{
					"footnote_index": 5,
					"page_target": 2
				}
			]
		},
		{
			"answer": "KO highlights significant progress in digitizing its customer interactions and leveraging data. Over 60% of customers are now digitized [1]. This digitization, part of the 'KO Ecosystem' strategy [2], enables initiatives like 'Suggested Order' pilots and enhances connections through platforms like Studio X, which links 9 operating units [3]. The company achieved a +2.6% increase in KO Trip Incidence in 2024 [1] and uses insights from consumption history, behavior patterns, drinking occasions, first-party data, and media usage to anticipate consumer needs and personalize offerings [4]. Increased data collection is cited as a driver for speed in marketing, with digital mix reaching ~65% in 2024 [3]. This focus on digitization aims to attract more consumers, moving them from 'Neutrals' or 'Intenders' to 'Weekly+' purchasers [5].",
			"query": "Digitization appears to be a key strategic pillar. What progress has KO made in digitizing its customer base and operations, according to the presentation metrics? How is the company leveraging data and digital tools to enhance customer engagement, marketing effectiveness, and potentially drive sales?",
			"query_sub_type": [
				"strategy_analysis",
				"kpi_analysis",
				"revenue_growth_driver_kpi"
			],
			"query_type": [
				"other",
				"revenue"
			],
			"sources": [{
					"footnote_index": 1,
					"page_target": 7
				},
				{
					"footnote_index": 2,
					"page_target": 18
				},
				{
					"footnote_index": 3,
					"page_target": 16
				},
				{
					"footnote_index": 4,
					"page_target": 6
				},
				{
					"footnote_index": 5,
					"page_target": 5
				}
			]
		},
		{
			"answer": "KO achieved a +1 point value share gain in the NARTD (Non-alcoholic ready-to-drink) industry between 2022 and 2023 [1]. This gain occurred in a market where KO held 29% value share in 2023, up from 26% in 2015 [1]. During this period (2015-2023), ~80 other large players saw their collective share decrease from 43% to 40%, while 2,000+ 'Shifting Players' (local, new, private-label) maintained a 31% share [1]. This indicates KO is successfully capturing share primarily from other large, established players rather than the fragmented smaller/local brands. Specific brand drivers mentioned include Coca-Cola Zero Sugar gaining significant market share [1] and the growth of acquired brands like fairlife and BodyArmor [2].",
			"query": "Coca-Cola reported a +1pt value share gain in the NARTD industry in 2023 vs 2022. Based on the market share evolution chart from 2015 to 2023, from which competitor segments (Other Large Players vs. Shifting Players) is KO primarily taking share?",
			"query_sub_type": [
				"kpi_analysis",
				"competition_analysis",
				"revenue_growth_driver_kpi"
			],
			"query_type": [
				"other",
				"revenue"
			],
			"sources": [{
					"footnote_index": 1,
					"page_target": 9
				},
				{
					"footnote_index": 2,
					"page_target": 13
				}
			]
		},
		{
			"answer": "The presentation provides Non-GAAP reconciliations for Organic Revenues [1], Earnings Per Share (Comparable EPS) [2, 3], Free Cash Flow (including adjustments for IRS deposit and fairlife payment) [4, 5, 6], Operating Margin (Comparable) [7], ROIC [8, 9, 10, 11, 12], Net Debt and Leverage [13, 14], and Net Share Repurchases [15]. Key recurring adjustments impacting comparability include foreign currency fluctuations, acquisitions/divestitures/structural changes for revenue [1], and various 'items impacting comparability' for EPS, Operating Income/Margin, and EBITDA [2, 7, 13, 14]. These items are not explicitly detailed in the CAGNY deck itself but are reconciled in the appendix tables, impacting metrics like Net Income and Operating Income used in Non-GAAP calculations [16, 17]. The company notes limitations in reconciling forward-looking Non-GAAP measures like 2025 organic revenue and comparable EPS due to unpredictability of FX, M&A timing, and comparability items [18].",
			"query": "Analyze the key Non-GAAP adjustments Coca-Cola makes to its reported financials as detailed in the Reconciliation appendix. What are the major categories of adjustments (e.g., currency, M&A, specific items), and how significantly do they impact core metrics like Revenue, EPS, Operating Margin, and FCF based on the provided tables?",
			"query_sub_type": [
				"non_gaap_reconciliation_analysis",
				"revenue_growth_driver_kpi",
				"gross_margin_analysis",
				"free_cash_flow_stack_definition_calculation"
			],
			"query_type": [
				"margins",
				"revenue",
				"cash_flow"
			],
			"sources": [{
					"footnote_index": 1,
					"page_target": 36
				},
				{
					"footnote_index": 2,
					"page_target": 37
				},
				{
					"footnote_index": 3,
					"page_target": 39
				},
				{
					"footnote_index": 4,
					"page_target": 38
				},
				{
					"footnote_index": 5,
					"page_target": 40
				},
				{
					"footnote_index": 6,
					"page_target": 42
				},
				{
					"footnote_index": 7,
					"page_target": 41
				},
				{
					"footnote_index": 8,
					"page_target": 29
				},
				{
					"footnote_index": 9,
					"page_target": 45
				},
				{
					"footnote_index": 10,
					"page_target": 46
				},
				{
					"footnote_index": 11,
					"page_target": 49
				},
				{
					"footnote_index": 12,
					"page_target": 50
				},
				{
					"footnote_index": 13,
					"page_target": 47
				},
				{
					"footnote_index": 14,
					"page_target": 48
				},
				{
					"footnote_index": 15,
					"page_target": 52
				},
				{
					"footnote_index": 16,
					"page_target": 43
				},
				{
					"footnote_index": 17,
					"page_target": 41
				},
				{
					"footnote_index": 18,
					"page_target": 2
				}
			]
		},
		{
			"answer": "KO's strategy for its sparkling portfolio, termed the \"Sparkling Renaissance,\" focuses on driving growth in both Colas and Flavors [1]. KO's average volume growth has outpaced industry average volume growth consistently from 2019 to 2024 [1]. Coca-Cola is highlighted as the 'Top Consumer Brand in the World' based on 2024 retail value, with the sparkling portfolio delivering $60B in retail value growth from 2014 to 2024 [1]. Key growth drivers include Coca-Cola Zero Sugar, noted for significant market share gains [2], and innovations like taste improvements [3]. Despite this strength in Colas, the company acknowledges a 'Significant Opportunity to Close the Share Gap' in Flavors (like Sprite and Fanta) compared to Colas, based on 2024 value share [1].",
			"query": "The presentation refers to a \"Sparkling Renaissance.\" What is Coca-Cola's strategy for driving growth in its core sparkling portfolio, including both Colas and Flavors? How has KO's volume growth compared to the industry, and where does the company see opportunities within this category?",
			"query_sub_type": [
				"strategy_analysis",
				"revenue_growth_driver_kpi",
				"segment_revenue",
				"competition_analysis"
			],
			"query_type": [
				"other",
				"revenue"
			],
			"sources": [{
					"footnote_index": 1,
					"page_target": 14
				},
				{
					"footnote_index": 2,
					"page_target": 9
				},
				{
					"footnote_index": 3,
					"page_target": 17
				}
			]
		},
		{
			"answer": "KO presents a strong track record of returning cash to shareholders. The company highlights 103 consecutive years of dividend payments and 62 consecutive years of dividend growth [1]. In 2024, dividends per share reached $1.94, up 5% from $1.84 in 2023 [1]. Net share repurchases were $1.1B in 2024, following $1.7B in 2023, $0.6B in 2022, and net issuances in 2021 and 2020 [2, 3]. The presentation notes repurchases are typically used to offset dilution [2]. Dividends paid ($8.359B in 2024 [4]) represent a significant portion (73% in 2024 [5]) of Adjusted Free Cash Flow ($11.510B in 2024 [6]), indicating a strong commitment to the dividend, supplemented by opportunistic buybacks.",
			"query": "Detail Coca-Cola's capital return policy as evidenced by its dividend history and share repurchase activity presented for the period 2020-2024. How consistent has the company been in returning cash via these two methods, and what is the stated purpose of the repurchases?",
			"query_sub_type": [
				"capital_deployment_options_evaluation",
				"kpi_analysis"
			],
			"query_type": [
				"cash_flow",
				"other"
			],
			"sources": [{
					"footnote_index": 1,
					"page_target": 29
				},
				{
					"footnote_index": 2,
					"page_target": 30
				},
				{
					"footnote_index": 3,
					"page_target": 52
				},
				{
					"footnote_index": 4,
					"page_target": 44
				},
				{
					"footnote_index": 5,
					"page_target": 27
				},
				{
					"footnote_index": 6,
					"page_target": 43
				}
			]
		},
		{
			"answer": "KO emphasizes sustainability and 'Enhancing Our License to Operate' as a strategic pillar [1]. Key metrics and initiatives highlighted include: 68% of the 2023 beverage portfolio having fewer than 100 calories per 12oz serving; 30% of 2023 volume sold being low- or no-calorie; 800 product reformulations in 2023-2024; returning 148% of water used in finished beverages to nature/communities in 2023 [2]. On packaging, 95%+ of primary consumer packaging is designed to be recycled; 62% was collected for recycling in 2023; 27% recycled materials were used globally in primary packaging in 2023, with 17% rPET used in PET bottles [2]. Partnerships with WWF and local stakeholders address water stewardship, and a JV with Indorama Ventures supports bottle-to-bottle recycling in the Philippines [2]. These efforts address risks related to health perceptions, packaging regulations, water scarcity, and environmental concerns [3].",
			"query": "How is Coca-Cola addressing sustainability and its 'Social License to Operate'? Provide specific examples and metrics from the presentation related to portfolio health (calories), water stewardship, and packaging circularity (recyclability, collection rates, recycled content).",
			"query_sub_type": [
				"strategy_analysis",
				"risk_analysis",
				"kpi_analysis"
			],
			"query_type": [
				"other"
			],
			"sources": [{
					"footnote_index": 1,
					"page_target": 12
				},
				{
					"footnote_index": 2,
					"page_target": 20
				},
				{
					"footnote_index": 3,
					"page_target": 2
				}
			]
		},
		{
			"answer": "The presentation outlines KO's long-term growth model targets: 4-6% Organic Revenue growth, 6-8% Comparable Currency Neutral Operating Income growth, 7-9% Comparable Currency Neutral EPS growth, and a 90-95% Adjusted Free Cash Flow Conversion Ratio [1, 2]. For 2025 specifically, the guidance is: 5-6% Organic Revenue growth, 8-10% Comparable Currency Neutral EPS growth, 2-3% Comparable EPS growth, and $9.5B Free Cash Flow (excluding the fairlife contingent consideration payment) [3]. The significant difference between the 8-10% currency neutral EPS growth and the 2-3% comparable EPS growth guidance for 2025 implies an anticipated headwind from foreign currency exchange rates of approximately 6-7 percentage points, a risk factor explicitly mentioned [3, 4].",
			"query": "Compare Coca-Cola's stated long-term growth algorithm targets (Organic Revenue, Comp Currency Neutral Op Inc, Comp Currency Neutral EPS, Adj. FCF Conversion) with the specific guidance provided for 2025. What does the difference between 2025 Comparable Currency Neutral EPS growth and Comparable EPS growth imply about expected currency impacts?",
			"query_sub_type": [
				"forward_looking_guidance_assumptions",
				"risk_analysis"
			],
			"query_type": [
				"outlook",
				"other"
			],
			"sources": [{
					"footnote_index": 1,
					"page_target": 10
				},
				{
					"footnote_index": 2,
					"page_target": 31
				},
				{
					"footnote_index": 3,
					"page_target": 10
				},
				{
					"footnote_index": 4,
					"page_target": 2
				}
			]
		},
		{
			"answer": "KO's debt structure appears robust, supported by strong credit ratings (Moody's A1 / S&P A+) [1]. The company successfully issued debt in 2024 with over-subscription, indicating market confidence [1]. As of year-end 2024, total debt (Non-GAAP) was $44.5 billion, comprising $1.5B in loans/notes payable, $0.6B current maturities of LT debt, and $42.4B in long-term debt [2]. Net debt was $30.0 billion [2]. Approximately $15 billion in debt is coming due within the next five years (presumably 2025-2029) [1]. The company maintains significant debt capacity ($12.6B relative to its 2.5x leverage target ceiling) even after accounting for 2024 performance [3], suggesting flexibility to manage upcoming maturities and potential future needs.",
			"query": "Describe Coca-Cola's debt structure as presented, including its credit ratings, recent issuance activity, total and net debt levels at year-end 2024, and the scale of upcoming maturities over the next five years. How much debt capacity does the company estimate it has?",
			"query_sub_type": [
				"debt_analysis_structure_covenants",
				"balance_sheet_liquidity_analysis",
				"financial_health_risk_assessment"
			],
			"query_type": [
				"balance_sheet"
			],
			"sources": [{
					"footnote_index": 1,
					"page_target": 30
				},
				{
					"footnote_index": 2,
					"page_target": 48
				},
				{
					"footnote_index": 3,
					"page_target": 48
				}
			]
		}
	]
}
KO Q4 2024 Annual Report 10-K Evals
{
	"content_uid": "1fd8e2f1-94e0-4ddc-a84a-4a559d6ce141",
    "content_name": "KO Q4 2024 Annual Report 10-K",
    "evals": [
	  {
			"answer": "Net revenues increased by $1,307 million (3%) in 2024, reaching $47,061 million [1]. This growth includes a significant 11% positive impact from price, product, and geographic mix, driven by favorable pricing initiatives across most segments, including inflationary pricing in specific markets like Türkiye, Zimbabwe, and Argentina [2, 3]. Volume contributed 2% to growth, reflecting higher concentrate sales volume after considering acquisitions and divestitures [1]. However, these gains were partially offset by a 5% unfavorable impact from foreign currency exchange rate fluctuations, primarily due to a stronger U.S. dollar against currencies like the Argentine peso, Nigerian naira, and Japanese yen [2, 4], and a 4% negative impact from acquisitions and divestitures, mainly reflecting the refranchising of bottling operations in the Philippines, Bangladesh, and India [2, 5].",
			"query": "Net revenue grew 3% YoY to $47.1bn. Deconstruct this growth by quantifying the specific contributions from volume, price/mix, foreign currency fluctuations, and acquisitions/divestitures as detailed in the MD&A.",
			"query_sub_type": ["revenue_growth_driver_kpi", "price_volume_decomposition", "mix_acceleration", "segment_revenue"],
			"query_type": ["revenue"],
			"sources": [{
					"footnote_index": 1,
					"page_target": 50
				},
				{
					"footnote_index": 2,
					"page_target": 50
				},
				{
					"footnote_index": 3,
					"page_target": 50
				},
				{
					"footnote_index": 4,
					"page_target": 51
				},
				{
					"footnote_index": 5,
					"page_target": 51
				}
			]
		},
		{
			"answer": "Gross profit margin increased by 160 basis points, from 59.5% in 2023 to 61.1% in 2024 [1]. The primary driver for this expansion was the impact of favorable pricing initiatives implemented across various markets throughout the year [1]. Additionally, the refranchising of bottling operations in the Philippines, Bangladesh, and certain territories in India contributed positively to the margin improvement, as finished product operations generally have lower gross margins than concentrate operations [1, 40]. These positive factors were partially offset by the unfavorable impact of foreign currency exchange rate fluctuations and higher commodity costs [1].",
			"query": "Gross margin expanded significantly from 59.5% to 61.1% YoY. Analyze the key drivers behind this improvement, quantifying the relative impacts of pricing initiatives, refranchising activities, FX fluctuations, and commodity costs as discussed on page 51.",
			"query_sub_type": ["gross_margin_analysis", "fixed_variable_semi_fixed_cost_analysis"],
			"query_type": ["margins"],
			"sources": [{
				"footnote_index": 1,
				"page_target": 51
			}]
		},
		{
			"answer": "Operating income decreased by $1,319 million (12%) YoY to $9,992 million in 2024 [1]. Key drivers included higher commodity costs, a $610 million (4%) increase in Selling, General and Administrative (SG&A) expenses (driven by advertising, stock compensation, and other operating expenses like charitable donations and prototype impairments) [2, 3], and significantly higher Other Operating Charges ($4,163 million in 2024 vs $1,951 million in 2023) [2]. The increase in Other Operating Charges was mainly due to a $3,109 million charge for the fairlife contingent consideration remeasurement and a $760 million impairment of the BodyArmor trademark [4]. The impact of refranchising bottling operations in the Philippines, Bangladesh, and India also negatively affected operating income [1]. Furthermore, unfavorable foreign currency exchange rates had an 11% negative impact [1]. These negative factors were partially offset by concentrate sales volume growth of 2% (adjusted for structural changes) and favorable pricing initiatives [1].",
			"query": "Operating income declined 12% YoY despite positive revenue growth and gross margin expansion. Detail the primary factors driving this decline, referencing specific SG&A components, Other Operating Charges (including fairlife and BodyArmor impacts), refranchising effects, and FX headwinds.",
			"query_sub_type": ["incremental_margin_analysis", "operating_expense_analysis", "specific_event_margin_impact"],
			"query_type": ["margins"],
			"sources": [{
					"footnote_index": 1,
					"page_target": 53
				},
				{
					"footnote_index": 2,
					"page_target": 52
				},
				{
					"footnote_index": 3,
					"page_target": 52
				},
				{
					"footnote_index": 4,
					"page_target": 52
				}
			]
		},
		{
			"answer": "Net cash provided by operating activities plummeted by $4,794 million (41%) to $6,805 million in 2024 [1]. The most significant driver was the $6.0 billion payment for the IRS Tax Litigation Deposit related to the 2007-2009 tax years [1, 2]. Other contributing factors included an unfavorable impact from foreign currency fluctuations, higher other tax payments beyond the litigation deposit, increased charitable donations, and reduced operating cash flows from refranchised bottling operations [1]. Higher annual incentive payments due to prior year performance also contributed to the decrease [1]. Partially offsetting these outflows were strong underlying cash operating results and a cash inflow from the transfer of $523 million in surplus international pension plan assets to general assets [1, 3]. The prior year (2023) also included a $167 million milestone payment for fairlife and payments related to inventory buildup, the absence of which slightly mitigated the YoY decline [1].",
			"query": "Operating Cash Flow decreased sharply by 41% ($4.8bn) in 2024. Beyond the $6.0bn IRS Tax Litigation Deposit payment, what were the other primary operational and financial drivers contributing to this significant decline, as detailed in the Cash Flow statement and MD&A?",
			"query_sub_type": ["free_cash_flow_stack_definition_calculation", "quality_of_earnings_analysis", "working_capital_analysis"],
			"query_type": ["cash_flow"],
			"sources": [{
					"footnote_index": 1,
					"page_target": 59
				},
				{
					"footnote_index": 2,
					"page_target": 57
				},
				{
					"footnote_index": 3,
					"page_target": 102
				}
			]
		},
		{
			"answer": "The Company recorded a $760 million impairment charge on the BodyArmor trademark during 2024, recognized within Other Operating Charges [1, 2]. This impairment was triggered by lower-than-expected operating results related to the trademark during the first quarter of 2024, prompting a revised projection of future operating results [1]. The decrease in the trademark's fair value was primarily driven by these revised projections and higher discount rates resulting from changes in macroeconomic conditions since the acquisition date in November 2021 [1]. As of December 31, 2024, the fair value of the BodyArmor trademark approximated its carrying value, indicating continued risk of future impairment if near-term results don't meet revised projections or if macroeconomic conditions worsen [1]. The remaining carrying value of trademarks with indefinite lives was $13,301 million [3].",
			"query": "The Company recorded a significant $760 million impairment charge related to the BodyArmor trademark in 2024. Explain the specific triggers for this impairment test, the key factors driving the fair value reduction, and assess the remaining risk based on the disclosure that its fair value now approximates carrying value.",
			"query_sub_type": ["intangibles_goodwill_analysis", "specific_event_margin_impact"],
			"query_type": ["balance_sheet", "margins"],
			"sources": [{
					"footnote_index": 1,
					"page_target": 45
				},
				{
					"footnote_index": 2,
					"page_target": 52
				},
				{
					"footnote_index": 3,
					"page_target": 69
				}
			]
		},
		{
			"answer": "The Company is appealing the Tax Court's decision which resulted in a $6.0 billion liability (including interest) for the 2007-2009 tax years, paid in September 2024 [1, 2]. The Company believes the IRS and Tax Court misinterpreted and misapplied transfer pricing regulations in reallocating income from foreign licensees [2]. Furthermore, KO argues the retroactive imposition of tax using a methodology different from the previously agreed-upon and audited Closing Agreement (used from 1996-2006) is unconstitutional [2, 3]. The appeal will likely leverage recent Supreme Court decisions (e.g., Loper Bright v. Raimondo) that limit judicial deference to agency interpretations [2]. Despite paying the $6.0 billion deposit, the Company maintains a tax reserve of only $474 million as of Dec 31, 2024, reflecting its assessment that its tax positions are 'more likely than not' to be ultimately sustained on appeal [4]. However, if the appeal fails, KO faces potential additional liabilities of approximately $12 billion for the 2010-2024 tax years, plus ongoing incremental annual tax increases [4].",
			"query": "Detail the Company's stated legal arguments for appealing the Tax Court decision regarding the IRS dispute (2007-2009), including its views on the Closing Agreement and recent administrative law precedents. How does the $474M reserve reconcile with the potential $12bn+ exposure for subsequent years?",
			"query_sub_type": ["risk_analysis", "related_party_transactions"],
			"query_type": ["other", "outlook"],
			"sources": [{
					"footnote_index": 1,
					"page_target": 57
				},
				{
					"footnote_index": 2,
					"page_target": 33
				},
				{
					"footnote_index": 3,
					"page_target": 32
				},
				{
					"footnote_index": 4,
					"page_target": 34
				}
			]
		},
		{
			"answer": "The Bottling Investments segment saw unit case volume decrease by 23% in 2024 [1]. This significant decline was primarily driven by structural changes, specifically the refranchising of bottling operations in the Philippines, Bangladesh, and certain territories in India during February and December 2024 [1, 2]. Excluding the impact of these structural changes, unit case volume for Bottling Investments actually grew by 5% [1, 3].",
			"query": "Bottling Investments unit case volume declined 23% YoY. Reconcile this decline with the segment's underlying performance, explaining the impact of the refranchising activities in the Philippines, Bangladesh, and India.",
			"query_sub_type": ["segment_revenue", "revenue_growth_driver_kpi"],
			"query_type": ["revenue"],
			"sources": [{
					"footnote_index": 1,
					"page_target": 49
				},
				{
					"footnote_index": 2,
					"page_target": 48
				},
				{
					"footnote_index": 3,
					"page_target": 49
				}
			]
		},
		{
			"answer": "The Company repurchased 26.5 million shares for $1,694 million under the 2019 Plan in 2024, at an average price of $63.91 per share [1]. This resulted in a total cash outflow for treasury stock purchases of $1,795 million [1]. Considering stock issuances primarily related to employee stock option exercises, the net cash outflow from share purchases and issuances was $1,048 million [1]. As of December 31, 2024, approximately 76.3 million shares remained authorized for repurchase under the 2019 Plan [2]. Management stated its capital allocation priorities include using excess cash to repurchase shares over time, and expects to repurchase shares in 2025 to offset dilution from employee stock-based compensation plans [3].",
			"query": "Analyze the scale and cost of KO's share repurchase activity in 2024. How much authorization remains under the 2019 plan, and what is management's stated intention regarding repurchases in 2025 based on capital allocation priorities?",
			"query_sub_type": ["capital_deployment_options_evaluation", "forward_looking_guidance_assumptions"],
			"query_type": ["cash_flow", "outlook"],
			"sources": [{
					"footnote_index": 1,
					"page_target": 61
				},
				{
					"footnote_index": 2,
					"page_target": 37
				},
				{
					"footnote_index": 3,
					"page_target": 57
				}
			]
		},
		{
			"answer": "Total debt (Loans & Notes Payable + Current Maturities of LTD + Long-Term Debt) increased from $42,064 million at YE 2023 to $44,462 million at YE 2024, a net increase of $2,398 million [1]. Key activities included issuances of $12,061 million (including $8,752 million in long-term debt and $3,309 million in net commercial paper/short-term debt >90 days) [2]. This was offset by payments of $9,533 million (including $2,988 million of long-term debt, $5,276 million of CP/STD >90 days, and $1,269 million net payments of CP/STD <90 days) [3]. The increase supported operational needs, share repurchases, dividends, and the $6.0 billion IRS litigation deposit payment [4, 5]. The long-term debt carries a weighted-average effective interest rate of 3.4% [6].",
			"query": "Analyze the key drivers of the net change in total debt during 2024, detailing major issuances and repayments of short-term borrowings, commercial paper, and long-term debt as disclosed in the financing activities section of the cash flow statement and Note 11.",
			"query_sub_type": ["debt_analysis_structure_covenants", "capital_deployment_options_evaluation"],
			"query_type": ["balance_sheet", "cash_flow"],
			"sources": [{
					"footnote_index": 1,
					"page_target": 69
				},
				{
					"footnote_index": 2,
					"page_target": 60
				},
				{
					"footnote_index": 3,
					"page_target": 61
				},
				{
					"footnote_index": 4,
					"page_target": 61
				},
				{
					"footnote_index": 5,
					"page_target": 57
				}
			]
		},
		{
			"answer": "The Company utilizes a trade accounts receivable factoring program where it can elect to sell receivables at a discount to unaffiliated financial institutions [1]. In 2024, KO sold $21,873 million of receivables under this program, up from $17,704 million in 2023 [1]. The costs associated with this factoring increased to $114 million in 2024 from $83 million in 2023 [1]. These costs are recorded in Other Income (Loss) - Net [2]. The cash received from these sales is classified within operating activities in the cash flow statement [1]. This program allows KO to manage liquidity, although the increased volume and cost suggest potentially greater use or higher discount rates in 2024.",
			"query": "Describe the mechanics and scale of KO's trade accounts receivable factoring program. How much was factored in 2024 versus 2023, what was the associated cost, and where are these costs and cash flows reflected in the financial statements?",
			"query_sub_type": ["working_capital_analysis", "cash_conversion_cycle", "quality_of_earnings_analysis"],
			"query_type": ["balance_sheet", "cash_flow"],
			"sources": [{
					"footnote_index": 1,
					"page_target": 74
				},
				{
					"footnote_index": 2,
					"page_target": 55
				}
			]
		},
		{
			"answer": "The Company's effective tax rate increased to 18.6% in 2024 from 17.4% in 2023 [1]. The statutory U.S. federal rate remained 21.0% [1]. Key factors influencing the 2024 rate included a 1.1% increase from state and local taxes (net of federal benefit) and a 1.0% favorable impact from earnings in jurisdictions taxed at different rates [1]. Equity income provided a 2.6% benefit, and excess tax benefits on stock-based compensation provided a 0.5% benefit [1]. The 'Other - net' category provided a 1.4% benefit, which includes the impact of tax incentive grants ($346 million benefit) [2] and net expense related to uncertain tax positions and other discrete items [1, 3]. The increase from 17.4% to 18.6% appears driven primarily by lower net benefits from 'Other - net' (1.4% benefit in 2024 vs 2.0% benefit in 2023) and a less favorable impact from earnings mix (1.0% benefit in 2024 vs 0.3% detriment in 2023), partially offset by a larger benefit from equity income (2.6% vs 2.1%) [1]. Note 15 also mentions a 1.2% adverse impact ($161M) from agreed-upon tax issues with foreign jurisdictions in 2024 [4].",
			"query": "KO's effective tax rate increased from 17.4% in 2023 to 18.6% in 2024. Analyze the key components driving this rate change, referencing the reconciliation provided in Note 15, including jurisdictional earnings mix, equity income, stock compensation benefits, and the 'Other - net' category.",
			"query_sub_type": ["non_gaap_reconciliation_analysis"],
			"query_type": ["margins", "other"],
			"sources": [{
					"footnote_index": 1,
					"page_target": 55
				},
				{
					"footnote_index": 2,
					"page_target": 55
				},
				{
					"footnote_index": 3,
					"page_target": 109
				},
				{
					"footnote_index": 4,
					"page_target": 108
				}
			]
		},
		{
			"answer": "The Company faces significant risk from unfavorable geopolitical conditions, explicitly citing international conflicts like those in Ukraine and the Middle East, which caused operational disruptions in 2024 [1]. These instabilities can lead to logistical/supply chain issues, business disruptions (including labor shortages), increased cybersecurity risk, higher input costs (transportation, energy, raw materials), and potential product boycotts due to political activism [1]. Furthermore, the Company notes risks from potential restrictions on transferring earnings/capital, price controls, new tariffs, import restrictions, and U.S. trade sanctions against certain countries, which could make sales difficult or impossible [1]. Retaliatory sanctions against U.S. multinationals are also a concern [1].",
			"query": "Based on the Risk Factors section, how have recent geopolitical events specifically impacted KO's operations in 2024, and what are the key ongoing risks management identifies related to international conflicts, trade policies, and sanctions?",
			"query_sub_type": ["risk_analysis", "forward_looking_guidance_assumptions"],
			"query_type": ["outlook", "other"],
			"sources": [{
				"footnote_index": 1,
				"page_target": 15
			}]
		},
		{
			"answer": "The Company plans to sunset its Global Ventures operating segment effective January 1, 2025, to streamline and simplify its operating structure [1]. This segment primarily oversaw Costa, innocent, and doğadan, plus Monster distribution coordination fees [1]. Post-sunset, Costa (excluding ready-to-drink), innocent, and doğadan will report into the Europe, Middle East and Africa (EMEA) operating segment [1]. Costa's ready-to-drink business and the Monster-related fees will become the responsibility of the respective geographic operating segments [1]. This strategic shift aims to simplify reporting and potentially integrate these ventures more closely with geographic operational structures.",
			"query": "Management announced plans in November 2024 to sunset the Global Ventures operating segment. Describe the rationale provided and detail how the businesses currently within Global Ventures (Costa, innocent, doğadan, Monster fees) will be reallocated across the remaining operating segments effective January 1, 2025.",
			"query_sub_type": ["strategy_analysis", "segment_revenue"],
			"query_type": ["other", "revenue"],
			"sources": [{
				"footnote_index": 1,
				"page_target": 6
			}]
		},
		{
			"answer": "The Company's total worldwide unit case volume grew 1% in 2024, reaching 33.7 billion unit cases [1, 2]. Sparkling soft drinks represented 69% of this volume, consistent with 2023 [1]. Trademark Coca-Cola accounted for 47% of worldwide volume, also flat YoY [1]. Geographically, the U.S. represented 16% of total volume (down from 17% implied in 2023 based on 33.3bn cases), with 61% of U.S. volume from sparkling soft drinks and 42% from Trademark Coca-Cola [1]. Outside the U.S. (84% of total volume), Mexico, China, Brazil, and India were the largest markets, collectively accounting for 33% of worldwide volume [1]. Non-U.S. volume was 71% sparkling soft drinks and 48% Trademark Coca-Cola [1].",
			"query": "Analyze KO's 2024 worldwide unit case volume performance, detailing the overall growth rate, the contribution from sparkling soft drinks and Trademark Coca-Cola, the geographic split between the U.S. and international markets, and the key international countries.",
			"query_sub_type": ["revenue_growth_driver_kpi", "geographic_revenue", "segment_revenue"],
			"query_type": ["revenue"],
			"sources": [{
					"footnote_index": 1,
					"page_target": 8
				},
				{
					"footnote_index": 2,
					"page_target": 49
				}
			]
		},
		{
			"answer": "The Company faces cybersecurity risks including unauthorized access, data theft, viruses, ransomware, and other intrusions [1]. Its risk management program, integrated with ERM, uses a multilayered approach to identify, evaluate, mitigate, and prevent threats [1]. This includes technical safeguards benchmarked against frameworks like NIST, coordination across consolidated entities, and processes for incident response (triage, assessment, escalation, containment, remediation) [1]. The internal audit team assesses controls, and external advisors assist with risk management [1]. Employee training covers social engineering, phishing, and data protection [2]. A third-party risk management program addresses risks associated with bottlers and suppliers, including security assessments and regular meetings between KO's CISO and key bottlers [1, 2]. While incidents to date haven't been material, management acknowledges the evolving threat landscape and maintains cybersecurity insurance, though coverage may not be sufficient for all potential losses [1, 3].",
			"query": "Summarize KO's cybersecurity risk management strategy and governance structure as detailed in Item 1C. What specific measures are employed for internal systems, third-party risk (including bottlers), incident response, and employee training?",
			"query_sub_type": ["risk_analysis", "kpi_analysis"],
			"query_type": ["other"],
			"sources": [{
					"footnote_index": 1,
					"page_target": 29
				},
				{
					"footnote_index": 2,
					"page_target": 30
				},
				{
					"footnote_index": 3,
					"page_target": 26
				}
			]
		},
		{
			"answer": "The Company's five largest independent bottling partners by unit case volume in 2024 were Coca-Cola FEMSA, Coca-Cola Europacific Partners (CCEP), Coca-Cola Hellenic (HBC), Arca Continental, and Swire Coca-Cola [1]. Combined, these five bottlers represented 44% of KO's total worldwide unit case volume in 2024 [1]. This highlights a significant concentration, although the Company emphasizes these are independent contractors, not legal partners or agents [1]. A deterioration in the financial health or strategic alignment of these key bottlers could materially impact KO's concentrate sales and overall system performance [2].",
			"query": "Identify KO's five largest independent bottling partners based on 2024 unit case volume and state their combined percentage contribution to total worldwide volume. What risk does this concentration pose?",
			"query_sub_type": ["kpi_analysis", "risk_analysis", "strategy_analysis"],
			"query_type": ["other", "revenue"],
			"sources": [{
					"footnote_index": 1,
					"page_target": 8
				},
				{
					"footnote_index": 2,
					"page_target": 21
				}
			]
		},
		{
			"answer": "The Company's total workforce decreased from approximately 79,100 employees at YE 2023 to 69,700 at YE 2024, a reduction of 9,400 employees or about 12% [1]. This decrease was primarily attributed to refranchising activity during 2024, which involved transferring ownership of bottling operations (and associated employees) in markets like the Philippines, Bangladesh, and parts of India to independent bottlers [1, 2]. The U.S. employee count remained relatively stable at approximately 8,900 (vs. 9,000 in 2023) [1].",
			"query": "KO's total employee count decreased significantly from 79,100 in 2023 to 69,700 in 2024. What is the primary reason cited for this reduction, and how did the U.S. headcount change during this period?",
			"query_sub_type": ["kpi_analysis", "strategy_analysis"],
			"query_type": ["other"],
			"sources": [{
					"footnote_index": 1,
					"page_target": 13
				},
				{
					"footnote_index": 2,
					"page_target": 48
				}
			]
		},
		{
			"answer": "The fairlife contingent consideration liability increased significantly from $3,017 million at YE 2023 to $6,126 million at YE 2024 [1, 2]. This liability relates to the remaining milestone payment for the 2020 fairlife acquisition, contingent on fairlife achieving certain financial targets through 2024, payable in 2025 [3]. The increase during 2024 was primarily due to a $3,109 million charge recorded in Other Operating Charges, reflecting the remeasurement of this liability to fair value based on updated performance expectations and potentially other valuation inputs [4, 5]. This large upward revision suggests fairlife's performance significantly exceeded the expectations embedded in the prior year's estimate.",
			"query": "The fairlife contingent consideration liability more than doubled to $6.1bn at YE 2024. Explain the nature of this liability and analyze the reason for the significant increase during the year, referencing the remeasurement charge recorded in Other Operating Charges.",
			"query_sub_type": ["balance_sheet_liquidity_analysis", "specific_event_margin_impact"],
			"query_type": ["balance_sheet", "margins"],
			"sources": [{
					"footnote_index": 1,
					"page_target": 93
				},
				{
					"footnote_index": 2,
					"page_target": 116
				},
				{
					"footnote_index": 3,
					"page_target": 115
				},
				{
					"footnote_index": 4,
					"page_target": 52
				},
				{
					"footnote_index": 5,
					"page_target": 119
				}
			]
		},
		{
			"answer": "The Company's capital expenditures were $2,064 million in 2024, up from $1,852 million in 2023 [1]. The allocation by segment shows Bottling Investments received the largest share at 35.6%, followed by North America at 29.2%, and Corporate at 23.6% [1]. Global Ventures accounted for 9.9%, while EMEA and Asia Pacific had minimal shares (0.8% and 0.9% respectively) [1]. The significant allocation to Bottling Investments reflects ongoing investment in consolidated bottling operations, while the North America spend supports its large operational base. Corporate capex likely relates to headquarters, technology, and potentially R&D facilities [2]. Management guided 2025 capital expenditures to be approximately $2.2 billion [3].",
			"query": "Analyze the allocation of KO's $2.1bn in capital expenditures across its operating segments and Corporate in 2024. Which segments received the most significant investment and what is the guided Capex for 2025?",
			"query_sub_type": ["capex_analysis", "segment_revenue", "forward_looking_guidance_assumptions"],
			"query_type": ["cash_flow", "outlook"],
			"sources": [{
					"footnote_index": 1,
					"page_target": 60
				},
				{
					"footnote_index": 2,
					"page_target": 30
				},
				{
					"footnote_index": 3,
					"page_target": 57
				}
			]
		},
		{
			"answer": "The Company uses derivative financial instruments, primarily forward contracts, options, collars, and swaps, to mitigate risks from foreign currency exchange rates, commodity prices, and interest rates [1]. These are used to hedge underlying economic exposures and not for trading purposes [1]. Changes in fair value for qualifying cash flow hedges (e.g., hedging forecasted foreign currency cash flows or commodity purchases) are initially recorded in AOCI and reclassified to earnings when the hedged item affects earnings [2, 3]. Changes in fair value for qualifying fair value hedges (e.g., hedging fixed-rate debt) are recorded in earnings, offsetting the change in the hedged item's fair value [4]. Derivatives not qualifying for hedge accounting (economic hedges) have fair value changes immediately recognized in earnings [5]. As of YE 2024, the notional value of FX derivatives was $18.4bn and commodity derivatives was $386M [6, 7].",
			"query": "Describe the primary types of derivative instruments KO uses and the key market risks (FX, commodity, interest rate) they are intended to mitigate. Explain the different accounting treatments (OCI vs. Earnings impact) for cash flow hedges, fair value hedges, and economic hedges.",
			"query_sub_type": ["kpi_analysis", "risk_analysis"],
			"query_type": ["other"],
			"sources": [{
					"footnote_index": 1,
					"page_target": 79
				},
				{
					"footnote_index": 2,
					"page_target": 79
				},
				{
					"footnote_index": 3,
					"page_target": 87
				},
				{
					"footnote_index": 4,
					"page_target": 88
				},
				{
					"footnote_index": 5,
					"page_target": 90
				},
				{
					"footnote_index": 6,
					"page_target": 64
				},
				{
					"footnote_index": 7,
					"page_target": 65
				}
			]
		}
	]
}